Sep 012010
 

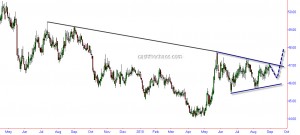
As mentioned in my August 27th post, the Indian Rupee has hit the upper borders of the trendline and looking at today's SGX Nifty at pre-open and early currency market moves, it may be moving along expected path. This is shown in the chart below:

USDINR Daily Chart

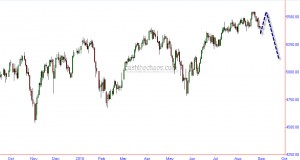
So if USDINR charts this path, the stock markets should take an inverse path - that either stalls under highs of August or makes a high slightly above 5600 and pulls lower sharply when INR breaks out of the symmetrical triangle. The chart below shows this scenario on Nifty.

Nifty Daily Charts

Channel lines puts pressure on Nifty

 Uncategorized  Comments Off on Channel lines puts pressure on Nifty
Aug 272010
 

First post from Singapore - settling down here took a bit longer than anticipated. OK, back to markets 🙂

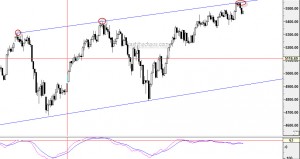
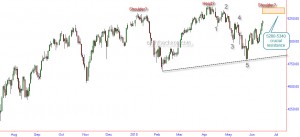
As can be seen from the chart below, the channel lines are putting pressure on the Nifty.

Nifty Daily Chart

Also, momentum peaks continues to disagree with the new price highs.

In my March 8th post, I had projected that Nifty should reach a minimum target in the region of 5600 but we dropped that stance in April expecting a correlated breakdown along with US markets. After initially declining to 4800 on the Nifty, Indian markets showed great resilience and outperformed almost every market in the world. So what has this got to do in the current context? The current high of Nifty satisfies the minimum level required for wave 5 completion (approx equals wave 1). Also, if Nifty closes below 5452 today (farther from this the stronger the signal ), a moderately negative to highly negative candle will be formed on the weekly charts.

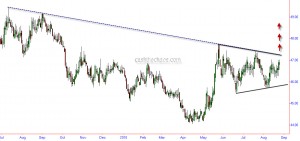
Looking at the USDINR crosses, a symmetrical triangle seems to be in play and the upper borders of this triangle shares a common boundary with a medium term trendline.  A convincing move above this level will mean more weakness for the Indian currency and as a corollary further weakness for the stock markets.

USDINR Daily Chart

My guess is that the Rupee will hit the upper borders today and pull back into somewhere into middle of the triangle to lower borders of the triangle, gather steam and then push past the 47.15 breakout level. If this scenario pans out - there might another push towards the high for the Nifty after the current decline. Let us see how the market pans out.

We were more focussed about going to cash and buying OTM puts as protection rather than going short between April and July. Considering that September is historically one of the weakest months, we will consider being short in a small way and try to build on them if situation warrants.

Jul 152010
 

Here is a chart of Indian Nifty in Dollar adjusted value.

Nifty daily chart - Dollar adjusted value

As is obvious from the above chart, Nifty has not even crossed the June highs, leave alone the April highs. And this could be the completion of a right shoulder in a head and shoulder top. While Nifty could very well continue to push higher and cross the highs of April in dollar terms- but other technical evidences at the moment do not favour that scenario. I guess by the time I post my next update from Singapore, markets should  have more evidence of which way they are headed.

Good trading to all!

Jun 302010
 

The Grand Daddy of technical analysis, the Dow Theory,  indicated that the US markets have slipped into a primary down trend - in other words known as a bear market. The Dow Industrials closed below its May trough of 9810, a day after the Dow Transportation Index closed below its May trough of 4034. I'm not even going to bother with the charts as I'm sure the internet is filled with this news.

In this process, US markets have also completed the H&S pattern we highlighted in our June 15th post https://www.cashthechaos.com/blog/?p=261

In the extreme short-term, US markets could be in for a bounce as the Nasdaq has had 8 consecutive down days and the Dow and S&P 7 down days in 8. While such a bounce is not a guarantee, if it occurs, it would be an opportunity to get short and get out of longs positions if any.

Indian markets which have shown tremendous resilience and outperformed world markets so far, may not do so for long.  Expect more intense selling pressure next time Nifty trades below 5259.

Jun 152010
 

Yesterday's close above 5200 on the Nifty does bring in some positives for the index but the bears may not have surrendered their last line of defence.

Nifty - Daily Chart

As can be seen from the above chart, the correction from the April highs to 4786 has happened in a 5 swing fashion - usually an indication that it is part of a larger correction. Also, potential for a head & shoulder top exists for the Nifty if it does not push through the resistance zone (shown shaded on chart).

Hence the bears may have dropped the advantage they had since April but their last line of defence may still be in place.

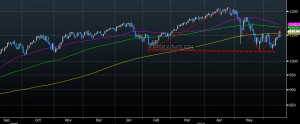
The potential for a head & shoulder reversal can also be seen on S&P 500.

S&P 500 Daily Chart - Data and Chart courtesy Bloomberg

So until further clarity surfaces, one may either sit on their hands  or may stay hedged on their short and long trades.

Jun 132010
 

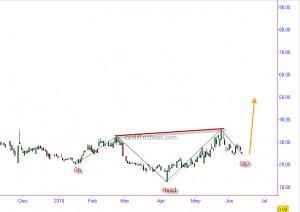
Here is the chart of India VIX. A reverse head and shoulder seems to be under construction.

What is important to note here is that the pattern formation is taking place after a very low reading on the VIX (read complacency). Once the reading crosses the neckline (35-36 level) a lot more volatility may be on the cards. A chart to keep tabs on.

Jun 072010
 

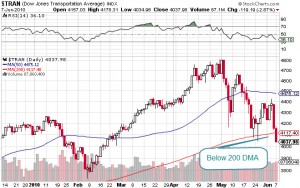
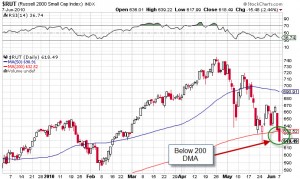
The Dow Transports and the small cap Russell 2000 closed below their respective 200 DMA.  These were the 2 important indices that held above this much tracked level all through the Month of May and this could mark another significant breakdown in the US markets.

Dow Transportation - Daily Chart

Russell 2000 - Daily Chart

As long as the Transportation index was holding above its 200 DMA the chances of recovery remained. Now with this move, those chances have gone up in smoke.

The small cap russell is a good measure of risk preference of investors. Once again, with a close below 200 DMA, the risk taking appetite has probably been flushed down the drain.

While Indian markets have been the best performer during the current decline amongst the BRIC countries - this may very well become the reason for a more pronounced sell off, as short sellers start targeting the out-performers.

For those interested, here is what I had said on CNBC this morning:

httpv://www.youtube.com/watch?v=cMtp9s7b20g

What can a Trillion dollars buy? – A day’s rally at best

 Uncategorized  Comments Off on What can a Trillion dollars buy? – A day’s rally at best
May 172010
 

A round of flu kept me down the whole of last week and I was not able post any updates on the markets (and this will be a bit brief too).  But a more serious attack was on least week - on the Euro.  A trillion dollar package to defend the 16 nation currency from further collapse failed to have the effect the euro zone politicians aimed to deliver.  By the end of the week the euro traded even lower than where it traded before the bailout.

In our April update, we had pointed to further downward momentum for the Euro and had expected 1.288 to 1.255 over the medium term. Although there is no visible reversal signs here and a close below 1.2330 can sink the currency to 1.18 levels, the currency is way too oversold and a short trade here looks like a crowded one.  A bounce to cleanse the excess bearishness and a possible resumption of down-trend post the bounce seems the likely path.

Dollar Index

Since 60% of the Dollar index's weight comes from the Euro, the Dollar was the de-facto beneficiary of the Euro's plunge. Our preferred wave count for this index has now undergone a change from what we had assumed a couple of weeks  ago.
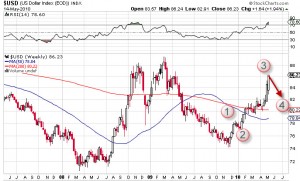
Further highs likely

The index is overbought in the short term and a pause or a pull back that refreshes the up-trend may be around the corner.  If what we saw over the last two weeks was safe-haven buying, more of the same is in store over the short to medium term. At least a test of the Mar09 highs is likely in the medium term.

Gold
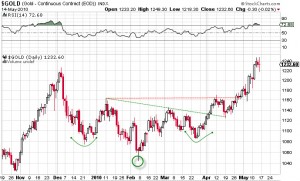
Gold at an all time high

When Gold went through the resistance at 1162 we had expected the commodity to probe the all time highs at 1227. The yellow metal not only did probe the highs but busted through that level to new all time highs.  With the auspicious day of "Akshaya Trithya" coming to end in India, the physical demand for the yellow metal is likely to take a breather and that may also translate into price action.  The technical backdrop for the commodity is still strong and we maintain our price objective of 1300-1480 for Gold over the short to medium term.

Stock Markets

USA

In my April update I did point to possibility, that we might be at the beginning of a pronounced correction and high volatility going forward. The markets were graceful enough to oblige and the high of 26th April has turned out to be a high of importance.

S&P 500

The recent market moves may have been volatile and may even seem erratic but the price action seems to suggest that lows of the 'flash crash' may not hold.
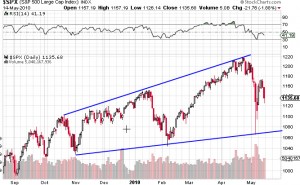
As can be seen from the chart above, ascending  broadening wedge formation on the S&P paints a bearish picture once again and by conventional measuring techniques, a move towards 1040 or near seems likely.

France

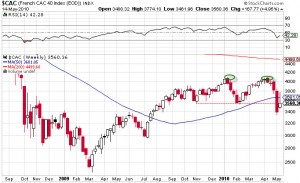
Now, the bears have a French Connection.  The CAC 40 index ploughed through the previous trough of 3560 and  as a result has completed a double top formation . A measured move towards 3000 level is on the cards.
BRIC Countries
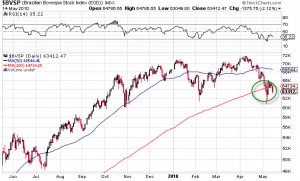
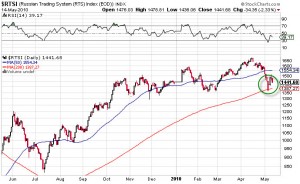
In our April update, we had pointed to the reversal in trend that was underway in the Chinese markets. The Shanghai composite has since tanked over 10% . The technical backdrop in the other three BRIC nations are also dangerously close to breaching an important support. While the Indian Nifty and Russsian RTSI have barely held above their 200 DMA, the Brazilian Bovespa has closed below its 200 DMA.

Bottom Line

The deterioration of technical structure in more and more world indices paints a grim picture of the current market climate.  Before we take a more aggressive posturing, we would like to see the Dow theory affirm these signals and only then do we want to believe that we are back to land of bears. Until such time, a conservative approach to the market is warranted.
Is INR poised for a brisk move?

 Uncategorized  Comments Off on Is INR poised for a brisk move?
Apr 122010
 

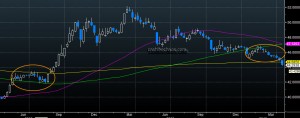
As can be seen from the weekly chart of INR, the currency has closed under the 200 period moving average after a period of consolidation. In Aug 2008, when INR went through a similar consolidation and closed above the 200 MA level, we saw a brisk 10% move (weakening of INR) in the next 2 months. Today, the picture is almost like an inverse mirror image (see circled region). Will the Rupee see a brisk move this time in the other direction (strengthening)?

Data and Chart courtesy: Bloomberg.