First post from Singapore - settling down here took a bit longer than anticipated. OK, back to markets 🙂
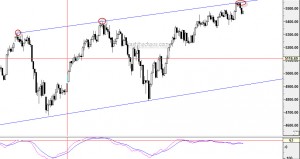
As can be seen from the chart below, the channel lines are putting pressure on the Nifty.
Also, momentum peaks continues to disagree with the new price highs.
In my March 8th post, I had projected that Nifty should reach a minimum target in the region of 5600 but we dropped that stance in April expecting a correlated breakdown along with US markets. After initially declining to 4800 on the Nifty, Indian markets showed great resilience and outperformed almost every market in the world. So what has this got to do in the current context? The current high of Nifty satisfies the minimum level required for wave 5 completion (approx equals wave 1). Also, if Nifty closes below 5452 today (farther from this the stronger the signal ), a moderately negative to highly negative candle will be formed on the weekly charts.
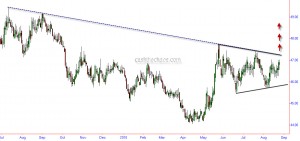
Looking at the USDINR crosses, a symmetrical triangle seems to be in play and the upper borders of this triangle shares a common boundary with a medium term trendline. A convincing move above this level will mean more weakness for the Indian currency and as a corollary further weakness for the stock markets.
My guess is that the Rupee will hit the upper borders today and pull back into somewhere into middle of the triangle to lower borders of the triangle, gather steam and then push past the 47.15 breakout level. If this scenario pans out - there might another push towards the high for the Nifty after the current decline. Let us see how the market pans out.
We were more focussed about going to cash and buying OTM puts as protection rather than going short between April and July. Considering that September is historically one of the weakest months, we will consider being short in a small way and try to build on them if situation warrants.


Sorry, the comment form is closed at this time.