Buffett’s Gold bashing is misplaced… once again

 Commodities  Comments Off on Buffett’s Gold bashing is misplaced… once again
May 092018
 

At Berkshire Hathaway’s annual meeting 2018 this weekend, Warren Buffett revealed that $10,000 invested in an S&P 500 index fund in 1942 (there were none at the time, he noted) would be worth $51 million today. However, $10,000 invested in Gold would be approximately $400,000. (This is not the first time Mr Buffett has taken a potshot at Gold, he did the same back in 2012 and I had a blog post https://www.cashthechaos.com/blog/2012/02/17/gold-the-buffett-slayer/)

When one is a Billionaire, one can say whatever one wants and try to pass it as wisdom or gospel truth. Let us examine these words of Avuncular Warren a little closer.

First, as Mr Buffett has rightly noted, there were no index funds back in 1942. What is unsaid and absolutely critical is that the first index fund was not around until the 1970's. So an investor would have needed all the sophistication to track the key stocks by market value, assign/reassign weights, balance/re-balance the portfolio and all that jazz that an index fund or an ETF does these days.  Remember, at its 50th anniversary of formation, the S&P500 had just about 80 odd of the original 500, and the 400+ companies had either gone bankrupt, been taken over or dropped off the index. So for 30 years! Was a normal investor expected to do that? How do you think that would have gone? Marquee Company's like Sears, Lehman, Radio Shack which were on the index for 50+ years went bust. Bear in mind, that when an investor looses 10% he/she needs 11.2% to break-even, 25% loss needs 33% to break-even and so on.

Second, it is very very important in the present world of QE, to understand what exactly is a Dollar. Only then can one understand the true value of the $51 million Mr Buffett is talking about. For millennia, real money was backed by tangible goods. Gold and Silver served this purpose. We know from history that President Roosevelt in 1933 and President Nixon in 1971 obliterated the US$ from being honest money. So what exactly is a Dollar backed by? Government bonds. Which is nothing but a promise to pay dollars. A promise on a promise and nothing tangible. Does "I promise to pay the bearer a sum of Rupees..." ring a bell? (And the central bankers call Crypto currencies as a scam!! )

What is a Dollar then? The US Congress describes the Dollar as 1/44.22 an ounce of Gold. That is if you pay $44.22 you can get an ounce or 28.35 gms of gold OR 1kg of gold for $1,560!!  Compare that to actual value of 1kg of gold as on date - $ 42,346!!

Now, why don't someone try taking these fiat dollars to the Treasury or the Fed and try to exchange it for 1kg gold per $1,560? After all these notes are the obligations of the United States of America. You would probably be dispossessed of your money and sent to a mental institution. The dollar had such value once upon a time. Today it has lost somewhere between 85% to 97% of it's value  - don't take my word, pull out the data from Federal Reserve and see for yourself. (From the St Louis Federal Reserve, Title: Board of Governors Monetary Base, Not Adjusted for Changes in Reserve Requirements, Series ID: BOGUMBNS, Source: Board of Governors of the Federal Reserve System, Release: H.3 Aggregate Reserves of Depository Institutions and the Monetary Base)

It is exactly this kind of dilution and dishonesty that Gold stands to protect. And it has. An ounce of gold will fetch a fine Louis Vitton or Hugo Boss suit.

Finally, here is a chart of Gold's performance vs Berkshire Hathway since 2002.

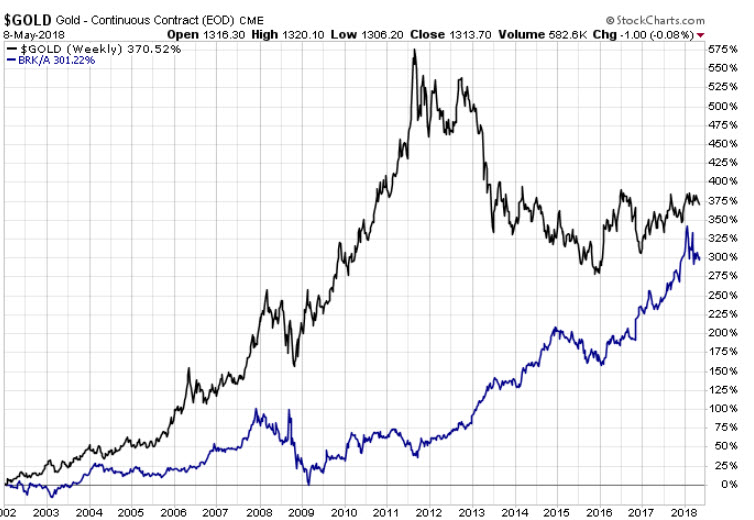
In 2012, gold was crushing the performance of BRK by 420%. Also one can see, Gold is still delivering 70% better returns than BRK since 2002, even after a steep drop from record highs. Buffett's BRK has completely missed the commodity boom. Hence, maybe he has a reputation guard?

Also, Berkshire has a cash reserve of over $100Bln. This reserve needs to go into something productive otherwise this poses a big problem for Buffett, especially if the dollar is going to loose value in the future.


 Posted by at 3:35 am

Outlook for Gold and Silver

 Commodities  Comments Off on Outlook for Gold and Silver
Jan 052014
 

The weekly chart of Gold with its Elliott Wave labelling is shown below.

Gold is moving within a large complex 4th wave  and the final 'Y' leg of the 4th wave may have just started.

Besides the June low of 1181, a couple of important Fibonacci support clusters are placed around 1180's. Also, on the day when Gold hit a low of 1186, a survey of futures traders who were bullish on Gold was a mere 5% - an extreme and market lows tend to occur around such sentiment extremes.

Therefore, the odds that Gold has seen an important low at the level of 1181 is quite high. Hence a short term trader may look to go long on Gold with a stop below $1180. Partial longs at current price and pullbacks around 1217-1210 to be used as further entry points. The wave Y is very likely to end close to the August high of Gold, roughly around 1425-30 and that will be the price objective of this trade set up.

Silver:

The technical structure of Silver is similar to that of Gold. Silver is moving within a large complex 4th wave  and the final 'Y' leg of the 4th wave may have just started.

Silver is unlikely to drop below the low of $18.6 seen last week. Hence traders may go long with a stop below 18.6 with a price objective of $25.2. Use decline to $19.7 and $19.5 as entry points with a small entry at current price of $20.2.

PS: There are legitimate alternate Wave Counts for both Gold and Silver but the alternates also point to a short term rally. Mr Market will tell us if we need readjust our wave counts. As of now even the least bullish case, points to a rally of $1350-60 for Gold.

Legal Disclaimer: This post gives an idea of how a trader chooses low risk entry points for trading and hence what you see in this post is for educational purpose only. This is no solicitation to buy, sell or hold any securities. I’m not a registered investment advisor and I strongly urge you to consult one if you are going to act on the above idea. If you decide to take action on the above idea, you are agreeing that you take full responsibility for the profit or loss that you may sustain based on such decisions and agreeing to indemnify the author of the same. You may have seen me on TV suggesting successful trade ideas but remember trading is inherently risky and past performance is no guarantee of future outcome.

PS: This was a premium digital content and has been unlocked now.


 Posted by at 11:41 pm

Baltic Dry Index breaks 2008 low

 Commodities, World Markets  Comments Off on Baltic Dry Index breaks 2008 low
Feb 022012
 

The Baltic Dry Index has been dropping continuously for the last 31 sessions. The index just broke through the 2008 low and this is worst reading on this index for the last two and a half decades.

Baltic Dry Index

If you are wondering why should this be of any significance - the index is a very important measure of the health of global economy. You could either believe the commentators who are saying that we are seeing rally in equity markets because Europe is "close to being solved" (when Maths 101 tells us its impossible) or pay attention to the warning signal from this index and stay cautious and try to be safe.

Dec 132011
 

Nifty(4760.60): It has taken just 3 sessions to retrace a little over 3/4ths of the move from 4640 to 5100. The probability that wave ii of wave 5 ended on Friday itself and the markets are progressing in wave iii of wave 5 is quite high. In simple terms, the markets are in the most powerful leg of the move within in this decline is very likely.

Nifty hourly charts

If this is the case, the minimum measurement for this powerful leg works out to 4505. In the extreme short-term, market could find support in the region of 4690-4720 and have a small relief rally or it may just plunge straight through 4690 and go for the breach of 4640.

In other markets, Gold has breached an important support .

Gold Daily charts

Ill keep this very simple - as can be seen from the chart above, a trendline has been established (blue dashed line) and Gold went below its previous support of  1667. Overnight, there was also a strong rally for the dollar index. If you want to short Gold, the stop is $1770 on the front month contract (a few points above Dec 2 high if you use any other contract). I expect Gold to hit 1410-1380 atleast in the first 6 months of 2012. To be honest, Gold has whipsawed me on a couple of occasions and that is the only reason for not having an official trade here but this is a clean set up, atleast for the short-term.

Silver: We are already short from 34.2 and have taken part profits. If silver drops below 30.65, add back the same quantity you booked at $31.4 and revise stop to 33 as stop for a target of $26.

 Posted by at 3:27 am
Nov 012011
 

It's been a while since our last post on precious metals. The price action right now seems to be offering a decent opportunity for a trade here.

Silver:

Silver Futures - Daily Charts

The last post on silver was on Sept 16th when Silver was around $40 and expected a decline to $26. We are labelling that as part of the third wave and the move off that low has been a struggle and it seems like a corrective pattern and hence labelling as corrective 4. If this is correct, Silver should see a drop to atleast 28.8, if not a new low to 24.5. So a high above the 28th October high would negate this view and should be used as a stop.

Gold:

The technical position for Gold is slightly different but direction is the same.

Gold Futures - Daily Charts

A move above the Oct 28th high would negate the bearish view but Gold is expected to trend lower to 1605 or 1513. A stop above 1755 is a must.

While I'm confident about these setup, the internal sub-divisions on these PM's is not ideal but I like the Dollar Index's internal sub-divisons. So I guess this should make for a neat trade.

 Posted by at 8:04 am
Sep 162011
 

Silver saw a steep drop from $50 to $32 in the month of May and the rise post that has been in a corrective fashion.

Silver - rising wedge

The above chart of silver shows a rising wedge pattern with a typical throw-over to the upside. Yesterday's close was well below the bottom of the rising wedge and this should usher in a sharp down move for the industrial metal probably before the end of this month. Looking at the chart from an Elliott wave perspective, silver is probably in its powerful 3rd wave or C wave which has the characteristics of wave 3. At $26.7 the first leg of the decline from 50 would be equal to the move from 44.27 (and hence A=C), the August peak, which seems like the minimum drop that is likely for silver. Also the $26 zone is the previous 4th for Silver.

Naturally, some of us would be thinking, "what happens to gold now?"

Gold Daily Chart - Potential for a double top

Here too, it is obvious that Gold is running into troubled waters. A fake print above 1913 high, momentum disagreeing with the new high in price are all tell-tale signs of exhaustion. A close below 1763 or an intraday drop below 1705 would complete a double top for gold and should draw prices at the very least to 1480.

Given the fact that the Dollar Index too had a breakout to the upside just a few days ago,  you might want to pay considerable attention to these signals in the precious metals space.

Aug 102011
 

The up move in Gold is starting to look similar to what silver was in April. Yesterday's intraday high of 1782 and a much lower close is the first warning sign. This does not necessarily mean that Gold will start crumbling right away. In fact an erratic rise, like the two scenarios shown on the chart below would give traders an ideal shorting opportunity and would be a classic parabolic end.

Gold - Daily Charts

In Technical terms: This is an extended wave 5. Almost always when the extended moves ends, it will be followed by a VERY HARD drop.

The sentiment picture: Talk to anyone around you, they will tell you must be insane not to own gold. I've been seeing facebook status from wannabe analysts and public stating heads or tails Gold wins. That is your sentiment picture screaming that the boat is about to capsize.

So, it is absolutely essential to understand that this not the time to create new long positions in Gold. If you are already long, be ready to fold.

May 062011
 

Just one day  prior to the anniversary of Dow's 1000 point crash, the Ghosts of the 'flash crash' came back to haunt risk assets with greater ferocity. Crude got walloped by 10%, Gold got slammed by over $50 and Silver was decimated by another 12% on top of its recent sharp drop!!

The force behind this move is the Dollar Index, which until now had refused to head higher despite being heavily oversold on multiple counts.

Dollar Index - Daily Chart

If you look the charts of UUP, the bullish dollar index fund, the 1.5% rise for this currency basket has come with a massive buildup in volumes. Also a gap up in UUP after a congestion holds the probability that the gains could stick and could even be a reversal.  A follow through in Friday' session for the USD would bode well for those rare Dollar Bulls. One thing that is quite clear, if this is not the reversal for the green-back, whenever it occurs, what we saw in yesterday's session is a mere curtain-raiser of things to come for risk assets.

Looking at the charts of Gold and Crude, there is more evidence that this is probably a turn of high significance for the intermediate to long term.

Gold: The weekly charts of Gold will end up being a bearish outside week (unless it recovers $40 in today's session) and this high probability reversal has occured at a very important time ratio as shown in the chart.

Gold - Bearish reversal

Crude: A bearish outside week in crude and  Price/Time have squared at the high.

Crude - weekly charts

Apr 272011
 

Silver's sharp decline after hitting a multi-decade high warrants close attention.

Silver- Daily Charts

The daily chart of silver above marks the "long-legged doji" which is a key warning of sign of an impending reversal. Moreover this pattern (a) has occurred after a prolonged and parabolic rise in silver (b) has seen follow through selling on very heavy volumes and (c) has faced resistance at the 1980 highs. These are mouth-watering signs for much lower prices for silver.

However I will probe this set up with a very small short trade - the Dollar Index has shown no signs of reversal and is merely consolidating near the lows. Unless the green-back turns up this might turn out to be just a fleeting drop in an up-trend.

Apr 132011
 

Brent Crude had formed an 'inside day' and it has now exceeded the range of this inside day, dropped hard to the downside. So, there is a high degree of probability that there is an intermediate term reversal in crude.

Brent - Daily Charts