Nov 302011
 

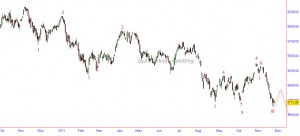
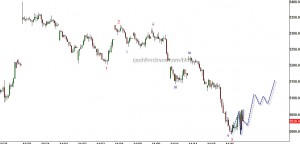
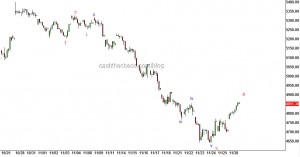
Nifty(4805.10): Did the counter trend rally end at 4866? Here is the wave count on the hourly chart.

Nifty - Intraday chart

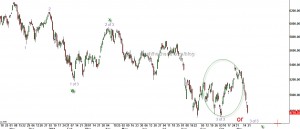
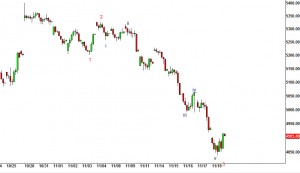
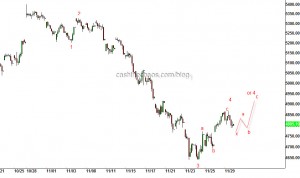
Nifty has failed to cross last week's high of 4873. Unless, there is another three wave correction (see chart), we may have to be open to the prospect that the upward correction was too weak and ended at 4866. If the market is undergoing a double three correction, Nifty should not drop below 4725. If it does, this would be another indication that wave red 4 ended at 4866. So today's intraday moves are going to be important and as long as Nifty stays below 4866 we will have to keep the option that red wave 5 has started a possibility. Once 4866 is crossed, Nifty is potentially on the path outlined( a double three) on the chart and the resistance at 4905-30 and 4980 would be the target zone for the rollover.

Open positions:

Silver: Short @$34.2 stop $33.5 partially booked at $31.4

Apollo Tyres: Long @64 stop 59 Tgt 71

Heromotors: Short @2025 sl 2130 Tgt 1900 (keep it flexible, will alert if the position needs to closed)
 Posted by at 3:09 am
Nov 292011
 

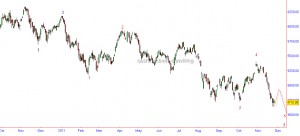
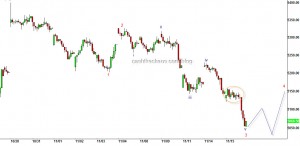
Nifty(4851): Finally, the long awaited relief rally kicked in and the markets are relieving the oversold levels. I do not think market should have any problem going above last weeks high of 4873 but if it doesn't its bearish and the powerful wave down is still incomplete. The ideal levels for this relief rally to roll-over to the downside are at 4901- 37 and 4983.

Nifty hourly chart

As per my time series analysis, December 8th(+ or - 1 day) points to an important high or low. I'm going with the probability of this being a low for two reasons (a) As can be seen from the chart above red wave 5 is still pending ; (b) Seasonally, December is one of the best months for India and India has not had a negative December for the last 9yrs. Hence, if we have a low on December 8th, markets could still be seasonally bullish and have another relief rally.

Ok now to yesterday's post - On yesterday's post - I had intentionally left an error, hoping one of you, particularly the Elliott Wave fans amongst would point to this error. The correct chart is here:

Nifty Daily chart - EW count

Now you EW fans- can you guys tell me what was the intentional error that was planted on yesterday's chart? I was just checking if you guys were paying attention to these notes 🙂

Open positions:

Silver: Short @$34.2 with revised stop at $33.5, partially booked @$31.4

Apollo Tyres: Long @64 stop 59, Target 71

Hero Motors: Short @2025 stop 2130 Target 1900 (greater bearish potential beyond 1900)

PS: I'll be on CNBC this morning. Will talk about Apollo and Hero if they ask about specific recommendations.

 Posted by at 12:34 am
Nov 282011
 

Nifty(4710): As promised the bigger picture on the Nifty

Basically, the purple wave 3 shown on chart is still in progress and is likely to end around 4380 when the red wave 5 completes its move. This is my preferred road map for the Indian markets. As mentioned in my January 19th 2011 interview with CNBC, the process of retesting the 2009 lows is very much on the cards. We will have some more clarity as to where the markets are headed once the the red wave 5 completes.

Open positions:

Silver: Short at $34.2 stop revised to $33.5, partially booked at $31.4

Apollo Tyres: Long at 64 with stop 59 Target 71

Hero Moto:  Short at 2025 with stop at 2130 tgt 1900

Hero Motors - Daily chart

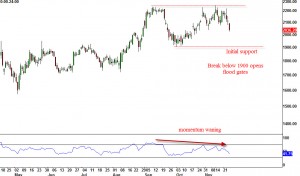
Watch out for Hero, the medium term picture is about to turn a corner, volumes picking up on downsides. Below 1900 might even drop to 1450. We will adjust dynamically.

 Posted by at 3:26 am
Nov 242011
 

Nifty(4706.45): The move from 5325 has been one of the strongest 'extended' waves I've have seen in recent times. When a market extends so strongly, relief rally that follows such extensions tend to be quite weak. So given this technical backdrop, the odds of this market exceeding 5000 now looks quite low. The ideal level for the relief rally to stop would be 4985, assuming the low markets made yesterday holds.

Supports remain the same: 4650 and 4530

Resistance are projected at 4790 and 4835

Open position(s):

Silver: Short with revised stop of $33.5 from $34.2

Positions closed yesterday:

Nifty November Long Guts(4900 put and 4800 call): Opening spread 184; Closing spread 250

 Posted by at 3:08 am
Nov 232011
 

Nifty(4812.35): Looking at pullback since 5325, they have been extremely short-lived and less than 90 points, pointing to a very strong supply.

Nifty intraday charts

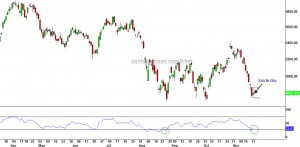
On the daily charts we have an "inside day" pattern, pointing to some indecision in the short term trend. Crossing the borders of the inside day resolves the indecision and often provides a directional move.

Nifty - Daily charts

Given the fact that the drop from 5325 has been almost one-way, it is a bit doubtful that markets have enough energy to break the major support at 4720. BUT there is still a window of possibility. So, if we see Nifty breach 4765 there is a shorting opportunity with a stop above 4855 for a new low below 4720. If you want to be aggressive, it is below 4782. Likewise, on the higher side if Nifty breaches 4855, a long trade potential exists for atleast 4920. This is a discretionary trade set-up, will alert by sms if there are any stock specific trades.

As mentioned before, supports below 4720 are at 4650 and 4530.

 Posted by at 2:54 am
Nov 222011
 

Nifty(4778.35): Given the ferocity of the decline from 5325, let us re-visit the big picture of Nifty and see where we are in the larger trend.

Nifty - Daily Charts with wave count

The speed of the decline is definitely of that of a third wave, which we have been marking as one on the daily updates. The possibility that we might still be in the 3rd wave in the bigger picture too is now a possibility. The implication of that is that there might one more leg of decline like the decline from April to August, after this downward leg is complete. This would work well with our call for INR 57+ to the dollar. It is also possible that green circled area shown on chart is a wave 4 of C of green Y. Either case, Nifty should drop closer to 4400. If Nifty breaks 4720 without a pause, the odds that we are still in the third wave (purple 3) would gain more weight. We will update on the bigger picture as things evolve.

Short term: Given that Nifty has been relentlessly dropping from 5325 to 4764, it is very doubtful it may have the energy to break the big support of 4720. A bounce to 5000+ would be the bare minimum but as we have been seeing extended waves are very difficult to pin down. In case, 4720 is broken supports to watch are at 4650 and 4530.

Open positions:

USDINR long from Oct 21st - Take profits here today (52.3 was November Fut close) - RBI will come under intense pressure to intervene. We will get in on a pullback for the next target of 57+

Silver - holding with upgraded stop of $34.2. Take Partial profits @$31.4

Nifty Long Guts: November with a debit spread of 184-188.

 Posted by at 12:48 am
Nov 212011
 

Nifty(4905): So far the short covering seems less apparent but as long as Nifty stays above 4830, we must assume the relief rally is in play (wave red 4)

In the event that 4830 is broken, there is a minor support at 4803 and only 4730 below that. The odds that it will sink straight there looks less likely. But extensions are difficult to pin down. On the higher side, the big resistance is at 5015. If Nifty does manage to go above that in the next few days, 5140 will put a cap on this rally and will present a low risk selling opportunity.

If anything calls for your attention, will alert by sms.

 Posted by at 3:21 am
Nov 182011
 

Nifty(4934.75): Once the important support at 4985 gave way, markets got rattled and a quick swoon followed. It was a combination of stop triggering and put writers of 5000 strike stepping in to cover their positions. What we had labelled as blue wave V turns out to be an extended blue wave iii. And only now the blue wave v of the red 3 seems to be in progress.

The supports for the markets are likely to be found around 4860 and 4830 the former gap left post the October 4th low. One fibonacci relationship ratio between blue wave iii and blue wave v also exists around this level. On the hourly charts, there is a fair amount of positive divergence developing and this is normally a precursor to a relief rally. Needless to say we will look to sell into it and the former target area of 5150 ballpark still holds good. But that is a few sessions away. If you are trying to create short positions, keep your position size small.

Open positions:

Long USDINR from Oct 21st revised stop 50.05 (November fut) -(partially booked day before yesterday)

Short Onmobile Global tgt 52 and beyond stop 62 at close

Silver Stop $35.7, revised stop $34.2

Silver had a big drop last night and this morning went below $31 in the asian session (currently at 31.5)

 Posted by at 2:56 am
Nov 172011
 

Nifty(5065.20): Nifty opened lower and drifted to support zone near 4985 before ending the day mildly higher from the lows of the day. The low of 4989 was just 4 points higher than the perfect 61.8% retracement of the move from October low of 4728 to October high of 5400. Essentially, Nifty may have found support in the extreme short-term. If you re-visit yesterday's note, the projected path for the red wave 4 was one dip below the low of wave blue v and that is exactly what came through from 5059 (a small panic to 4989).

Nifty Intraday charts

The idealised path for red wave 4 is shown above and we should red wave 4 to find resistance around 5150 zone. I'm also leaning towards the probability that what I have marked as red 3 may actually be subdivision 1 of  red 3 and the red 4 may actually be subdivision 2 of red 3. The implication of this this alternate count is that the next leg of decline from around 5150 (or wherever the correction ends) we are likely to see a very strong decline that may even break this year's low at 4720. For this alternate possibility to maintain value, we should see Nifty stay under 5225.

One of my time pivots points to an important low or high is coming through on December 8th (with 1 trading day tolerance on either side). So if the alternate count on Nifty is going to be right, expect a washout low around December 8th.

So if you are one of those who got long yesterday, you might be better of booking trades above 5140 Nifty and any longer-term position needs to be hedged.

Open Position: Silver short with stop of $35.7

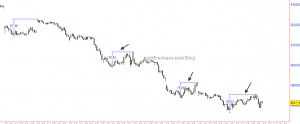
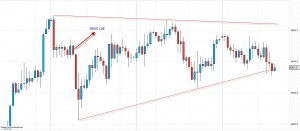
The above chart of Silver is a four hour price action since our short call. The metal seems set for a break of a triangle pattern but is still hesitating. As I write this, silver is trading at $33.80, if you hold multiple contracts take some profits here (I assume you got in around $34.20 like me) and maintain the same stop. If you are getting uncomfortable with this trade you can close the trade and jump back in when Silver breaches 33.15. Officially, I'm leaving this call open.

PS: I think the market is pricing in some kind monetisation by ECB which may explain the weakness in Euro along with strength in the Dollar along with Precious metals(PM's more often go inverse the dollar). This is just a wild guess.

 Posted by at 2:56 am
Nov 162011
 

Nifty(5068.5): It was highlighted here yesterday, that 5115 would offer some temporary relief to the market and a breach of that level would signal a further fall to 5045. Nifty opened lower paused at 5120, bounced gently, consolidated in a small range above between 5120 and 5160 and broke through the morning to clock a low of 5053 for the day.

Nifty Intraday charts

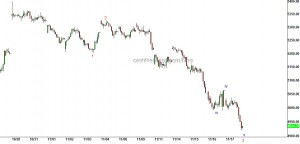
Yesterday's price action as greatly reduced the dip from 5400 being a corrective drop and hence we are labeling them as 1,2,3. First things first, if you are short, today's open or the first one hour might be a good opportunity to take profits, either fully or partially (We nearly got our 5045). The red 4 shown on chart has either started or about to start and it is going to be a bit tricky to  nail the end of this wave (most corrective waves are). Here is the broad idea - once again it looks unlikely that we will see a move beyond 5220. BUT, there is a small possibility that during this corrective rise, we might see a path as shown in the chart, with a small dip below 5000.  OR the morning session takes Nifty to either 5011 or 4985 and the red wave 4 starts from there. We all wish there was an easy way to nail the exact low 🙂 Don't we?

Open positions:

Long Reliance Nov 2011 840 put from 12

Silver Short with stop at $35.7 from $34.2

Hindustan Zinc Nov Fut Short from 122.5

Nifty Short from Monday morning ( close this today during the first 15mins or 5035-45 whichever comes first)

USDINR Long from 20-Oct-2011 stop 48.3

 Posted by at 2:46 am