Warning signs

 Indian Market/Stocks, US Markets, World Markets  Comments Off on Warning signs
Nov 012019
 

S&p 500:

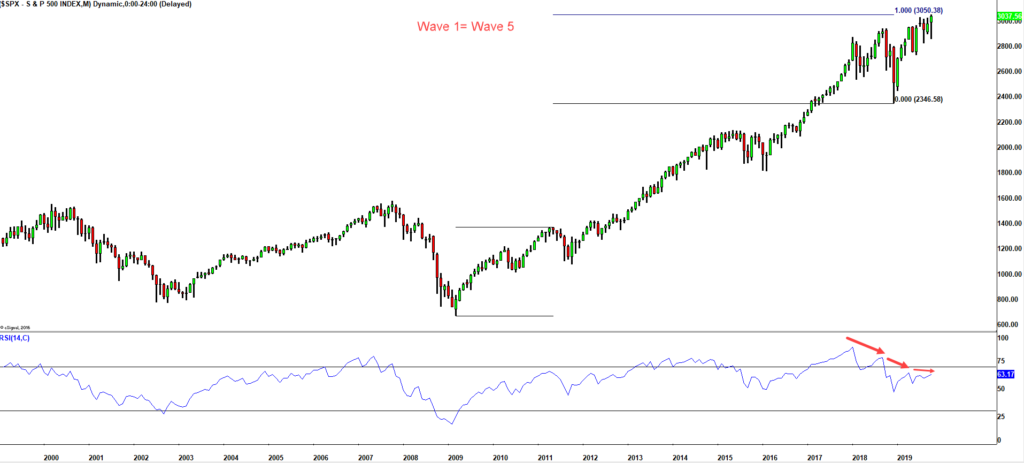
As can be seen from the monthly chart of S&P 500, the momentum for the Index has been dropping precipitously with each new high. (The loss of momentum is pretty much the same on Nasdaq & Dow as well). Under the Elliott Wave Model, I see the move from Dec 2018 as start of the 5th wave for S&P for the bull run that began in 2009. The wave principle states that two of the impulse waves tend towards equality. This is shown in the chart above.

Incidentally, Oct 2019 is 144 months from the high of financial crisis high - a very important Gann number. Invariably, significant highs and low's get registered from previous peaks and troughs (with a very tiny bit of tolerance on either side of this number)

Other Indices:

The Dow Jones Industrial is yet to clock record high. While it's not far off  and it may even clock fresh high in the next couple of days, it is lagging. We can even ignore this but:

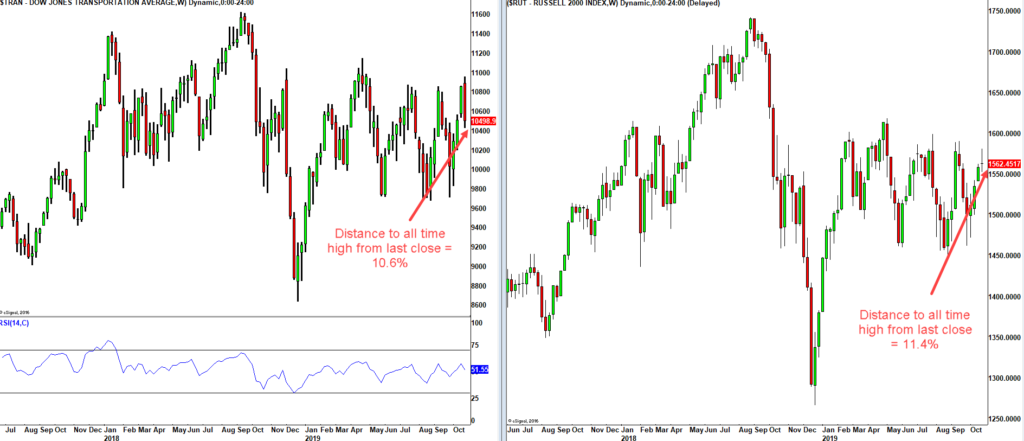
The Dow Transports and the small cap Russell 2000 (shown in the chart above) indices are over 10% from their record highs.

The famous FANG stocks which have been an important cog in this bull run are all lagging. Google while close to its all time high, failed to cross 1290 for the 3rd time. To clock fresh all time high - Netflix needs 45% +, Amazon 15% and Facebook 14%.

Sentiment:

At the record high of 3050 on the S&P reached couple of days back, the sentiment readings are very elevated. The number of futures traders who were bullish reached 80% (courtesy Daily Sentiment Index).  I've seen this reading go to 95% but this is at the extreme zone.

Here is another picture:

As I have shown on the monthly chart of  the S&P,  Wave 1 is right now = Wave 5. A sentiment equality could also be shaping up. In May 2011, Bin Laden was killed by US forces, post that , the S&P dropped 20%. Here just before the 3050 high, Al-Baghdadi has been killed by the US forces. This is once again being hailed as big amelioration of Geo-politcal risks for the market. Will history repeat?

I had spelt some of these thoughts on BQ here:
 Posted by at 4:10 am
Oct 222012
 

Apple dropped below 623.55 on Friday and that marked a 5 wave decline on a small degree. We know that when a market declines in 5 waves it normally happens to be a  part of a bigger move.

AAPL - 60mins chart, Data and Chart Courtesy Bloomberg

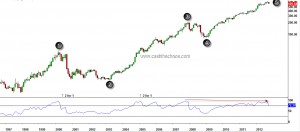
With that in mind, let us look at the bigger picture - the real big picture. As shown in the monthly charts below, it is possible to count 5 waves from the 1997 low. And at the top of wave 5 a clear drop in momentum readings - a disagreement between price and momentum.

Apple Monthly Charts; Data & Charts esignal

Wave 3 on the monthly charts saw a 6 fold increase and wave 5 was little over 3 times wave 1 through 3. The real kicker though is not the price relationship but the time relationship. Wave 3 was 2months longer than 1.618 times wave 1; Wave 4 and wave 2 have a perfect 0.382 Fibonacci relationship; and wave 5 is 0.78 times wave 3!!!

Let us zoom in little more closer - the weekly charts. The 5th wave starting from the 2009 low can be interpreted in a couple of ways.

AAPL weekly charts; Data and Charts - esignal

My interpretation is that the first wave within the 5th was extended. In that case we have a perfect ending relationship - Waves 3+5 are 0.382 times extended wave 1. The momentum divergence here is more pronounced than on the monthly charts.  So there is a good chance that the top 705 was a wave 5 top.

Seeing the above evidence, I lean towards the possibility that AAPL has seen a MASSIVE TOP, a 5th of a 5th. If I'm right, we are possibly looking at AAPL declining to $80 in the next 3-4 years. Either AAPL will burn cash or competition will crush AAPL or some other form of roadblock could be the reason but we are not bothered about the reasons. Reasons will come later. Think such a decline is not possible?  Think Nortel, Juniper, Himachal Futuristic, Satyam to name a few.  Short term: Apple could bounce from sub 600 to 650-674, if it does, I think it will be a low risk selling opportunity.

The broader implication if this analysis is correct - the world is up for some nasty months.

Disclosure: I'm short Apple. I own a couple of Iphones and an Ipad and I will be Queuing up for Apple's mini Ipad.

Baltic Dry Index breaks 2008 low

 Commodities, World Markets  Comments Off on Baltic Dry Index breaks 2008 low
Feb 022012
 

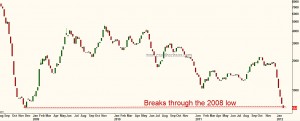
The Baltic Dry Index has been dropping continuously for the last 31 sessions. The index just broke through the 2008 low and this is worst reading on this index for the last two and a half decades.

Baltic Dry Index

If you are wondering why should this be of any significance - the index is a very important measure of the health of global economy. You could either believe the commentators who are saying that we are seeing rally in equity markets because Europe is "close to being solved" (when Maths 101 tells us its impossible) or pay attention to the warning signal from this index and stay cautious and try to be safe.

Nov 082011
 

Just look at the chart below - if you were wondering why did Nifty open lower when SGX Nifty was up or why did Nifty suddenly spike up from the low of the day - here is one snapshot that tells you everything. The time stamp at the bottom are London time. If you place these charts side by side for anyday in the last few weeks, it has a striking similarity.

EUR and Nifty

All interference work temporarily. Resources are finite. Once resources and words are exhausted, the underlying trend takes over.. with even more vigour.

 Posted by at 10:09 am
Oct 162011
 

Inter-market analysis provides an extra dimension to technical analysis - the peripheral vision and the backdrop in which we are operating. Here is one such inter-market factor. To me this is pretty much like looking at the charts of the Baltic Dry Index.

Over the last few weeks if you have been left wondering if the markets around the world have turned a corner, you might want to have look at the following pictures.

Vessels backlog 1

Vessels backlog - view from my Condo

Cargo backlog 2

Please click on these pictures and have a larger view. As you might understand from the caption, these are cargo vessels that have been standing idle for months together here in Singapore and some might be more than a year. The number of vessels over the last few months have only increased albeit at an alarming pace. Talk to anyone in the shipping business they would tell you what these pictures are telling. I personally know someone who owned a ship and went bankrupt - their next generation is still trying to pay off the debts and in all likely-hood, that person is unlikely to pay off the debt until their retirement age. The same would be true of corporations. In short, this is not a cheerful sign.

Singapore backlog - a small video clipping of the ECP coast (singapore).

 Posted by at 3:03 pm
Aug 042011
 

The price action over the last few days have been quite significant. Many world indices have seen reversal in their major trend.

S&P 500:

S&P 500 Daily Charts - Primary down trend

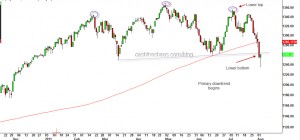
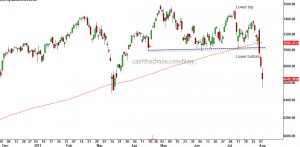
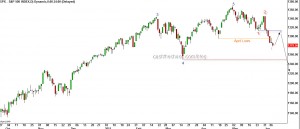
In my last post, I had warned that the S&P was poised to break the lows of June. Not only did that happen, the S&P took out the "Earthquake low" of March both on an intraday and closing basis. Some technicians might even make a case for a head and shoulders top for the S&P (see the violet ovals and the violet dotted line). Excluding the Nasdaq ,all other important indices -the transports, the industrials, Russell have also blown through their June lows and they all make a strong case for the start of a primary downtrend in the US markets.

FTSE:

FTSE Index - Triple top

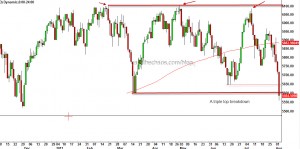
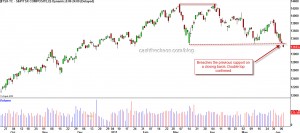
UK's FTSE index in a similar fashion has plunged through the June and "Earthquake lows". The close below 5650-5600 zone marks the completion of a triple top. Over the next few weeks and months one can expect this index to drop to about 5100.

French CAC:

CAC 40 Daily Charts

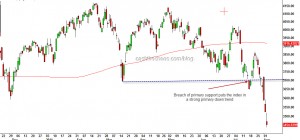
The CAC 40 was first among the major European indices to drop below its major support and reverse into a primary downtrend. The Index is trading at a 11month and has found temporary support at the 3400 levels. Look for more selling pressure post a relief rally.

German DAX:

The German DAX though above the March low, has clocked a clearly identifiable lower tops and lower bottoms and thus has slipped into a clear primary downtrend. As a confirmation to this reversal, it is very likely that we will see a move below 6500 on the DAX in the short-term.

A noticeable uniform similarity in all these charts is that all the indices are trading far below their respective 200 day moving average (the red line). This is not a corrective behaviour, this is typical bear market behaviour. While EM and DM looked oversold and are likely to bounce in the next few sessions, one must not mistake the relief rally as the end of the correction. I, for one,  would look for signs of the contagion spreading. Its starting to look like 2008 for global stock markets.

Jun 092011
 

The decline over the past few weeks has started to signal a top in some of the equity markets around the world. The Canadian TSX is one of those.

The chart above shows a confirmed double top for the Canadian TSX composite index. By conventional measuring techniques and by  Elliot wave principle this index should decline to 12300-11000 over the next several weeks from its current level of 13183.

The US S&P's decline below the April low is starting to resemble like the beginning of a powerful third wave. I expect a short-term bounce that relieves the oversold state and gets met with strong supply under 1311 S&P. If that happens expect the lows of  1248 (the post earthquake low ) to give way and the 1173-74 level will draw prices towards it. The next few days are key to this view.

Bottom Line: The global markets structure has started to weaken - The Russsian RTSI after a head and shoulder top in May is declining steadily; the Brazilian Bovespa has been clocking lower tops and lower bottoms since November just like the India Nifty (though this is marginally stronger in relative terms) ; the Shanghai Index too has been taking it on its chin since April.

 Posted by at 7:11 am
Mar 142011
 

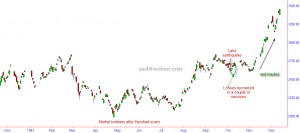
When earthquake/tsunami struck Japan on Friday, I'm sure you would have heard in the media how this was affecting the sentiments of the markets. Here are few things one must know :

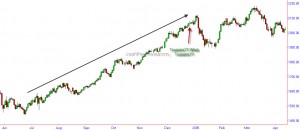
Let us take a look at the powerful Kobe Earthquake that struck Japan in 1995 and caused $102.5 billion damage:

Nikkei - during Kobe Earthquake

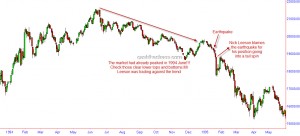
It is obvious from the chart that the Earthquake occurred during the down trend and did not create any reversal on its own.

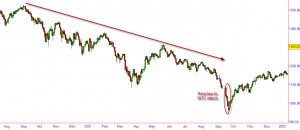
Now let us a look at the Latur Earthquake that left nearly 8000 dead in India and its impact on Sensex.

Sensex and Latur Earthquake

What about the Tsunami of 2004 that left 230,000 dead in Asia?

Nifty during Tsunami04

Looking at the charts, if one were to think no natural disaster occurred on Dec 26th 2004, he/she can be excused!!

The picture is similar even if one looked at the man-made disasters like Bomb blasts and terrorist attacks!

The infamous WTC attack:

While the reaction may have been pronounced, would it have mattered had it occured when the market trend was up?

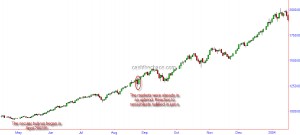
So let us look at markets reaction to mumbai serial blasts of August 2005:

Nifty during the Aug 03 Serial blast

So, the next time you hear someone on media say that such and such exogenous events is causing the markets to decline you might want give these charts a thought. While there might be initial knee jerk reactions, these events do not even cause short term reversals!!! All one has to know is, what is the trend.

Feb 112011
 

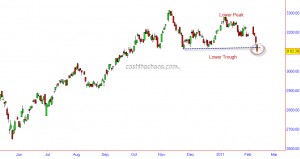
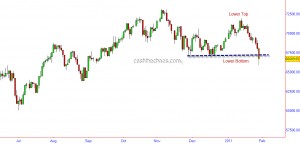
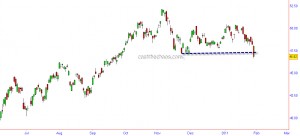
If you have been following my views on business channels, you would know that I have been saying for quite some time now that the decline in stock markets is not just restricted to one or two stock markets in the world. Many markets, frontier and emerging have been taking it in on their chin.

Yesterday, Singapore's STI joined the list of stock indices that have slipped into bear market territory.

The index ploughed through its previous trough and clocked lower top and lower bottom. The Hang Seng Index too is just within a hair's breadth of clocking lower lows and lower highs. A close for the Hang Seng Index below 22620( 88 points below yesterday's close) and this index can also be marked as having entered a bear market. The contagion is spreading.

Bears up the ante

 World Markets  Comments Off on Bears up the ante
Jan 312011
 

Brazilian Bovespa:

Bovespa Daily Charts

The BRIC Index

BRIC Fund - Daily Charts

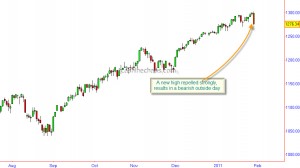
A reversal day in the S&P 500:

S&P500 - Daily Chart