Dark clouds forming for US Financials sector

 US Markets  Comments Off on Dark clouds forming for US Financials sector
Mar 222013
 

The US markets are at record highs and the financial press is abuzz with calls of "secular bull run" and huge targets for the Dow and S&P. Not entirely unwarranted, I would say. But what are the internals of the markets telling us now? Let us take a look at the financials sector, which outperformed the S&P by a wide margin since the summer of 2012.

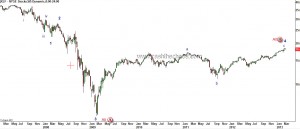
The big picture is always a good starting point and here is my Elliott wave count on the long term charts of XLF.

SPDR Financial Sector - Weekly Charts with EW counts

This is my preferred wave count and the price action so far seems to justify this view. The move from the 2009 low looked impulsive and initially warranted us to treat it as an impulse. BUT, the move off the 2012 low is not indicative of a powerful wave 3 (which it should have been if the initial move off 2009 low was an impulse). At least not so far. Also Waves a (blue a) and c (blue c) are related to each other by a typical fibonacci relationship that is indicative of a corrective rally.

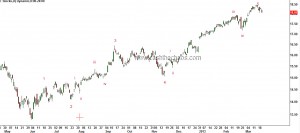
Now, let us zoom in on the move off the 2012 lows.

SPDR Financials - Daily Charts with EW Counts

Just eyeballing the waves here, one can easily discern that wave 5 (red 5) is the longest wave. In technical terms, this is called an extended 5th wave. Wave 5 (red 5) measures just a shade over equality to the distance traveled by waves 1 through 3 (red 1-3). The wave principle tells us that is a very common behavior for extended 5th waves. Momentum too has not made fresh highs when price made a high of 18.4 on the 14th of March 2013 (not shown on chart).

Adding all these evidence and taking into account the typical corrective behavior after an extended wave 5, we must not be surprised if XLF gets slotted down quickly to 15.5 from yesterday's close of 18.07 - a potential decline of ATLEAST 15%.

Could I be wrong? Sure. The financials could shoot higher and make me look silly. But, unless one takes a swing at such low risk set up's one cannot score big. Micheal Jordan had to miss 9000 shots in his career to become the greatest basketball player in history. So ago ahead, pull that trigger nevertheless.
Prepare yourself for a ‘sterling’ decline

 Currency  Comments Off on Prepare yourself for a ‘sterling’ decline
Feb 142013
 

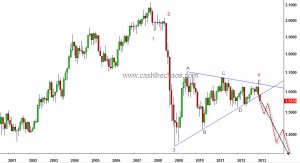
Cable (GBP/USD) has been moving in a triangle pattern since 2009 and yesterday's sharp and convincing dip below 1.5630 marked the end of this triangle formation.

Pound sterling breaks out of a 4 year triangle

Cable's monthly chart (above) with its Elliott Wave count shows that the currency is embarking on its 5th wave of decline. The target for this breakout is mammoth - Over the next 12-24 months we are very likely to see a level of 1.345 at the very least but will not be surprised if we see a level of 1.165.

When such a large text book pattern comes to fruition, clearly there will be some economic/fundamental tail wind supporting it. We are not going to bother ourselves with those and will leave it to the economists to decode that for us. However, we need to be aware  that such a large movement in a major currency is unlikely to occur in isolation. The Dollar will very likely strengthen against other major currencies. This is terrific news for Dollar Index bulls and bad news for many risk assets including precious metals and equities that rely on weak dollar forever.

Disclosure: I'm short sterling since January 2013 from 1.6113.

Oct 222012
 

Apple dropped below 623.55 on Friday and that marked a 5 wave decline on a small degree. We know that when a market declines in 5 waves it normally happens to be a  part of a bigger move.

AAPL - 60mins chart, Data and Chart Courtesy Bloomberg

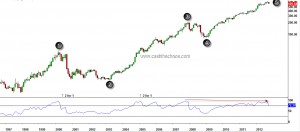
With that in mind, let us look at the bigger picture - the real big picture. As shown in the monthly charts below, it is possible to count 5 waves from the 1997 low. And at the top of wave 5 a clear drop in momentum readings - a disagreement between price and momentum.

Apple Monthly Charts; Data & Charts esignal

Wave 3 on the monthly charts saw a 6 fold increase and wave 5 was little over 3 times wave 1 through 3. The real kicker though is not the price relationship but the time relationship. Wave 3 was 2months longer than 1.618 times wave 1; Wave 4 and wave 2 have a perfect 0.382 Fibonacci relationship; and wave 5 is 0.78 times wave 3!!!

Let us zoom in little more closer - the weekly charts. The 5th wave starting from the 2009 low can be interpreted in a couple of ways.

AAPL weekly charts; Data and Charts - esignal

My interpretation is that the first wave within the 5th was extended. In that case we have a perfect ending relationship - Waves 3+5 are 0.382 times extended wave 1. The momentum divergence here is more pronounced than on the monthly charts.  So there is a good chance that the top 705 was a wave 5 top.

Seeing the above evidence, I lean towards the possibility that AAPL has seen a MASSIVE TOP, a 5th of a 5th. If I'm right, we are possibly looking at AAPL declining to $80 in the next 3-4 years. Either AAPL will burn cash or competition will crush AAPL or some other form of roadblock could be the reason but we are not bothered about the reasons. Reasons will come later. Think such a decline is not possible?  Think Nortel, Juniper, Himachal Futuristic, Satyam to name a few.  Short term: Apple could bounce from sub 600 to 650-674, if it does, I think it will be a low risk selling opportunity.

The broader implication if this analysis is correct - the world is up for some nasty months.

Disclosure: I'm short Apple. I own a couple of Iphones and an Ipad and I will be Queuing up for Apple's mini Ipad.

Jun 142011
 

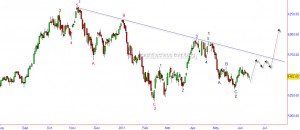
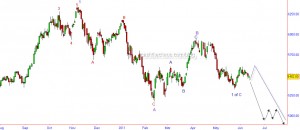
The Nifty has been in the range of 5600 to 5400 for the sixth week and has kept everyone guessing as to which way the range would resolve. As a good trader, one needs constantly play devil's advocate to your own views. So, here are the charts that present both the bullish and the bearish views.

If you are a bull:

Nifty - Daily Charts - as the bulls would like to read

The above Elliot wave count assumes that the November high was only a portion of a larger bull run and further gains are yet to follow. The violet wave 1 ended at the November highs and the subsequent decline into the January lows of 5177 completed the corrective wave violet 2 (which sub divided as a zig-zag red ABC).  This would mean that the move to the May high was wave 1 green (impulsive)  and is part of the powerful wave 3 violet which is likely to reach levels way beyond the all time highs.

Line in sand - If Nifty dips below 5320 it would weaken the bullish case though only a breach of 5177 would completely negate this option.

What's in favour? - Despite the global and regional weakness, India has been holding up well in the last few days.

What's against? - Reliance and ONGC ,the two heavy weights, are showing weakness. A big negative pattern  is under construction in ONGC. The assumed wave count to the May highs is a truncation - which normally does not help the case. The blue dotted trend-line shown is also likely to place a lid on the upward move.

If you are a bear:

Nifty - Daily Chart - as the bears would like to read

The bearish case has multiple options and I have taken the least bearish option. If we assume the November high was the end of violet wave 1, the decline into the January lows was only part of a larger correction Violet A, that sub-divided into red ABC. The rise into May high is assumed as corrective in nature, Violet B (which again sub-divided as blue ABC). The ongoing move from the May high is part of the Violet C wave decline which is expected to sub divide in to 5 waves. Of this 5 waves we have probably completed the first wave of the decline (blue 1 of Purple C) and we are the beginning of a powerful wave 3 (blue 3 of purple C) that would take market below 5000 (black arrows) or the corrective wave 2 is yet to complete(blue dotted path) before the powerful blue 3 of purple C takes Nifty well below 5000.

Line in sand - A move above 5650 would weaken the bearish case though only a breach of 5944 would force us to suspend the bearish bets.

What's in favour? - Exactly what is against the bullish case favours this - ONGC and Reliance. Also, the Dollar Index seems set for a powerful move that is likely to unleash a destructive move on most risk assets across the globe.

What is against? - Nifty has not managed to consolidate on the advantage of taking out the March lows and move briskly below the January lows.

PS: If you would like to know which side i'm leaning - i've been on the bearish side since November and I continue to do so.