Aug 262011
 

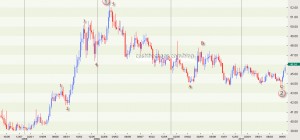
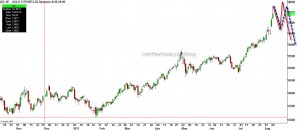
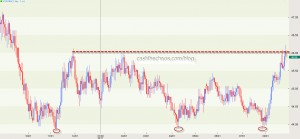
The Indian currency realised its triple bottom potential at the 43.85 level as the currency moved past 46 against the USD yesterday. The chart below shows the one year daily price movements of the currency and the bottoms are marked by the red oval. The price objective of the triple bottom pattern works out to a little over 48. Given that the stock markets are oversold and a bounce may come through for Indian stocks, INR could see a short-term pull back.

Indian Rupee - Triple bottom

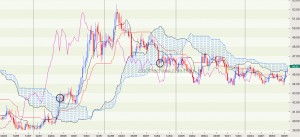
If the currency pair ends today above 46.1 today (a weekly closing), it would be closing above its weekly "cloud" for the first time since August 2009. This would be another bearish sign for the Rupee (I recall turning bullish on the Rupee in April 2009.)

Indian Rupee - Weekly Ichimoku charts

In 2008, when INR closed above the "cloud", the Rupee weakness lasted several months until it peaked at the level of 52.18.

If we look at the movements of the INR from an Elliott wave perspective - it does look like USD/INR is in it's early stages of its powerful wave 3. The triple bottom low of 43.85 is just a shade over the 62% fibonacci retracement level of the move from the 2008 lows to the March 2009 high. This is a very common wave relationship.

Now comes the staggering bit - if my wave labelling is correct, the potential for the Rupee over the next several months, works out to at least a little over 57 and a typical wave 3 relationship would take the rupee to a level of 65!!!!

So there it is, another asset class that is closely related to the Indian stock market's price movements, reiterating the bearish case for India.
Aug 252011
 

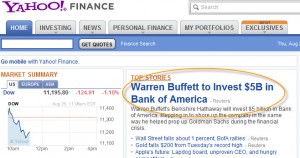
Buffett picks a stake in Bank of America

The BAC management takes a voluntary call from Mr Buffett and agrees to pay 6% on 5 billion for 10years or 300 million a year because they have LOADS and LOADS of capital to spare. YES, I BELIEVE IT, that must be the reason.

 Posted by at 3:26 pm
Aug 222011
 

Followers of this blog would know that I had been stubbornly insisting that the level of 4800-4700 on the Nifty has to come through before we could even talk about upside potential for the Indian markets. Having reached those levels on Friday, what next for the Indian markets?

In my June 14th post, we discussed the bullish and bearish possibilities for the NSE Nifty and had mentioned that the path shown for the bearish case was the bare minimum outcome. So if the bare minimum was 4800 Nifty, how much more can the Nifty head down? Now for the record, I was probably the only one who spoke about India having entered a bear market and the 2009 lows of Nifty being at risk as early as January 2011 and some of my friends in the media tell me the worst  they have heard so far is 4200 Nifty ( you might want to read here, here and here).

So what is the basis for 2009 lows? It is the BIG PICTURE on the Nifty.

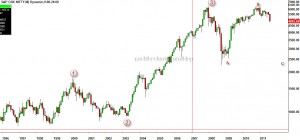
Nifty - Monthly Charts

The chart above shows the monthly movements of Nifty since 1995. Let me keep this simple without labouring too much into technical jargon. The charts are telling us that the Indian markets are probably still correcting the steep rise from 2003 to 2008 and the potential to revisit the lows of 2009 is still out there. Now slightly technical - Elliott Wave guidelines states that Waves 2 and 4 tends to alternate and since Wave 2 Circle was a zig-zag, the potential for wave 4 Circle to be a flat corrections is quite distinct.

Of course there are other possibilities (like Wave 4 circle ending up as a triangle) but given that we have highlighted in our August 4th post that the global markets are in a bear market, I see this as the preferred path. Of course, we will be flexible and listen to Mr Market if we see signs pointing in the other direction. We can expect the best from the markets but one has be prepared for the worst. So, do not be too early build a portfolio looking at the sharp fall in price.  Remember, that market bottom formation is NOT an EVENT, it is a process. Even if this view turns out to be wrong, we will end up buying the market say 2-4% higher than the big low registered. That I think is a fantastic insurance, given that the other scenario presents a market drop way way below current levels.

And for heaven sakes - do not think about QE3 coming in and changing the direction of the markets. Here is a little peek into what happened after QE2:

QE2 was announced on Nov 3rd, within days three of the indices from BRIC countries peaked (India, China and Brazil) and so did the Hang Seng Index, Singapore STI and Colombia Index. Within in a month of QE2 many frontier markets peaked. So, we are better off keeping track of the trend rather than the noise of news.

Aug 102011
 

The blame game begins 😀

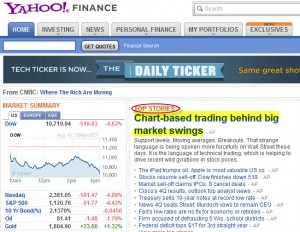
Did you ever doubt the movements in the stock markets over the last couple of weeks was not a bear market fluctuation? Here is proof that it is- the above headline captured from Yahoo/Reuters.

Wait a second. I thought fund managers never looked at charts. Wasn't it always their super intelligence and Ivy league education that drove their decision making process? You mean to say small guys who look at charts churned all those trillions of dollars of Market Cap across the globe and the fund managers just sat there and did nothing to prop up their NAV? No value buying? You mean to suggest that algorithmic trading do not take into account PE, Price to book and other parameters and just supports and resistance?

I've seen such Technical Analysis/ Chartist bashing in every bear market in the last 12 years. Having worked in an institutional broking arm in the past, I can tell you this - a technicians full worth is realised only in a bear market. The PE multiples, consensus forward earnings put forward by the leading broking arms are very rarely ever, leave alone being right, even close to being right. In a bullish environment these numbers give the illusion of being right. So when a bear market kicks in, the mirage disappears, everyone wants to speak to the chartist and understand where the markets are headed. Do you think I'm bashing fundamental analysis? Nope. Here is the proof.

Do you know what was the consensus earnings estimate in Jan-March 2008? It was close to 1000 for the sensex(check here and here). That number was revised down to 933 in Oct/Nov 2008 citing slowdown in economy (euphemism for I'm watching price action). Any guesses when that number was achieved? Now, HOLD YOUR BREATH!  And take care of your Jaw! We are yet to see that on Sensex!!!!! I'm not talking about the 1000, I'm talking about the revised number of 933. The BSE website shows the current earnings for the Sensex as 913!!!! The current forward earnings estimate for Sensex is around 1200. So the next time you hear markets are cheap compared to their earnings - you might want to think or ask "based on what? Trailing or Forward earnings?"

For fundamental analysis to be effective one must have an approach like that of Warren Buffett or the Chandler brothers who stay far far away from the action, observe, analyse the markets and pick value like a hawk.

Now do not get me wrong, I know some brilliant fundamental analysts in the industry who do not come up with silly numbers like cited above. But those guys are a very rare breed.(Example: So rare that one Fund manager made the CEO of Tata Power wait so that he could talk to an analyst friend of mine)

Aug 102011
 

The up move in Gold is starting to look similar to what silver was in April. Yesterday's intraday high of 1782 and a much lower close is the first warning sign. This does not necessarily mean that Gold will start crumbling right away. In fact an erratic rise, like the two scenarios shown on the chart below would give traders an ideal shorting opportunity and would be a classic parabolic end.

Gold - Daily Charts

In Technical terms: This is an extended wave 5. Almost always when the extended moves ends, it will be followed by a VERY HARD drop.

The sentiment picture: Talk to anyone around you, they will tell you must be insane not to own gold. I've been seeing facebook status from wannabe analysts and public stating heads or tails Gold wins. That is your sentiment picture screaming that the boat is about to capsize.

So, it is absolutely essential to understand that this not the time to create new long positions in Gold. If you are already long, be ready to fold.

Aug 042011
 

The price action over the last few days have been quite significant. Many world indices have seen reversal in their major trend.

S&P 500:

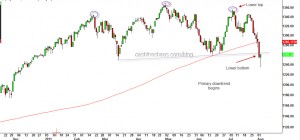
S&P 500 Daily Charts - Primary down trend

In my last post, I had warned that the S&P was poised to break the lows of June. Not only did that happen, the S&P took out the "Earthquake low" of March both on an intraday and closing basis. Some technicians might even make a case for a head and shoulders top for the S&P (see the violet ovals and the violet dotted line). Excluding the Nasdaq ,all other important indices -the transports, the industrials, Russell have also blown through their June lows and they all make a strong case for the start of a primary downtrend in the US markets.

FTSE:

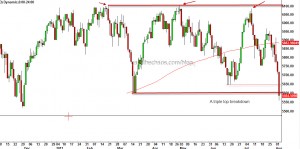
FTSE Index - Triple top

UK's FTSE index in a similar fashion has plunged through the June and "Earthquake lows". The close below 5650-5600 zone marks the completion of a triple top. Over the next few weeks and months one can expect this index to drop to about 5100.

French CAC:

CAC 40 Daily Charts

The CAC 40 was first among the major European indices to drop below its major support and reverse into a primary downtrend. The Index is trading at a 11month and has found temporary support at the 3400 levels. Look for more selling pressure post a relief rally.

German DAX:

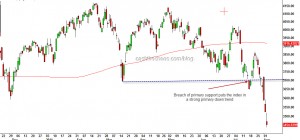
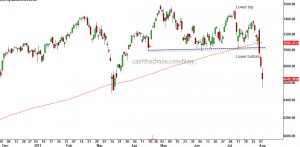
The German DAX though above the March low, has clocked a clearly identifiable lower tops and lower bottoms and thus has slipped into a clear primary downtrend. As a confirmation to this reversal, it is very likely that we will see a move below 6500 on the DAX in the short-term.

A noticeable uniform similarity in all these charts is that all the indices are trading far below their respective 200 day moving average (the red line). This is not a corrective behaviour, this is typical bear market behaviour. While EM and DM looked oversold and are likely to bounce in the next few sessions, one must not mistake the relief rally as the end of the correction. I, for one,  would look for signs of the contagion spreading. Its starting to look like 2008 for global stock markets.