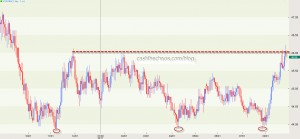
The Indian currency realised its triple bottom potential at the 43.85 level as the currency moved past 46 against the USD yesterday. The chart below shows the one year daily price movements of the currency and the bottoms are marked by the red oval. The price objective of the triple bottom pattern works out to a little over 48. Given that the stock markets are oversold and a bounce may come through for Indian stocks, INR could see a short-term pull back.
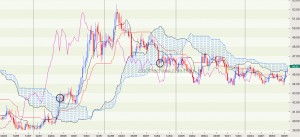
If the currency pair ends today above 46.1 today (a weekly closing), it would be closing above its weekly "cloud" for the first time since August 2009. This would be another bearish sign for the Rupee (I recall turning bullish on the Rupee in April 2009.)
In 2008, when INR closed above the "cloud", the Rupee weakness lasted several months until it peaked at the level of 52.18.
If we look at the movements of the INR from an Elliott wave perspective - it does look like USD/INR is in it's early stages of its powerful wave 3. The triple bottom low of 43.85 is just a shade over the 62% fibonacci retracement level of the move from the 2008 lows to the March 2009 high. This is a very common wave relationship.
Now comes the staggering bit - if my wave labelling is correct, the potential for the Rupee over the next several months, works out to at least a little over 57 and a typical wave 3 relationship would take the rupee to a level of 65!!!!
So there it is, another asset class that is closely related to the Indian stock market's price movements, reiterating the bearish case for India.


