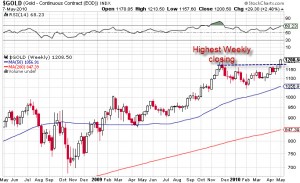
A round of flu kept me down the whole of last week and I was not able post any updates on the markets (and this will be a bit brief too). But a more serious attack was on least week - on the Euro. A trillion dollar package to defend the 16 nation currency from further collapse failed to have the effect the euro zone politicians aimed to deliver. By the end of the week the euro traded even lower than where it traded before the bailout.

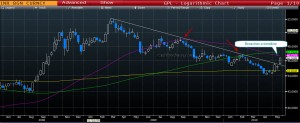
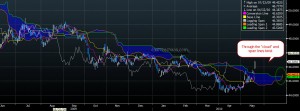
In our April update, we had pointed to further downward momentum for the Euro and had expected 1.288 to 1.255 over the medium term. Although there is no visible reversal signs here and a close below 1.2330 can sink the currency to 1.18 levels, the currency is way too oversold and a short trade here looks like a crowded one. A bounce to cleanse the excess bearishness and a possible resumption of down-trend post the bounce seems the likely path.
Dollar Index
Since 60% of the Dollar index's weight comes from the Euro, the Dollar was the de-facto beneficiary of the Euro's plunge. Our preferred wave count for this index has now undergone a change from what we had assumed a couple of weeks ago.
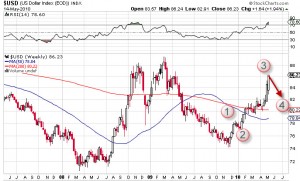
Further highs likely
The index is overbought in the short term and a pause or a pull back that refreshes the up-trend may be around the corner. If what we saw over the last two weeks was safe-haven buying, more of the same is in store over the short to medium term. At least a test of the Mar09 highs is likely in the medium term.
Gold
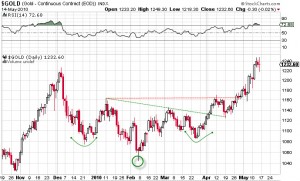
Gold at an all time high
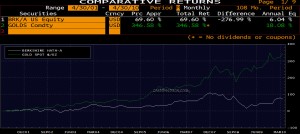
When Gold went through the resistance at 1162 we had expected the commodity to probe the all time highs at 1227. The yellow metal not only did probe the highs but busted through that level to new all time highs. With the auspicious day of "Akshaya Trithya" coming to end in India, the physical demand for the yellow metal is likely to take a breather and that may also translate into price action. The technical backdrop for the commodity is still strong and we maintain our price objective of 1300-1480 for Gold over the short to medium term.
Stock Markets
USA
In my April update I did point to possibility, that we might be at the beginning of a pronounced correction and high volatility going forward. The markets were graceful enough to oblige and the high of 26th April has turned out to be a high of importance.
S&P 500
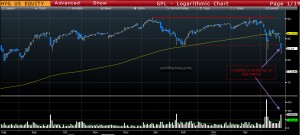
The recent market moves may have been volatile and may even seem erratic but the price action seems to suggest that lows of the 'flash crash' may not hold.
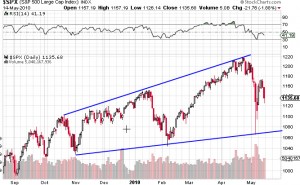
As can be seen from the chart above, ascending broadening wedge formation on the S&P paints a bearish picture once again and by conventional measuring techniques, a move towards 1040 or near seems likely.
France
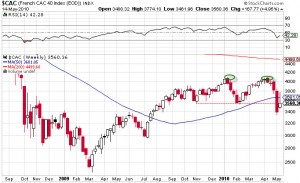
Now, the bears have a French Connection. The CAC 40 index ploughed through the previous trough of 3560 and as a result has completed a double top formation . A measured move towards 3000 level is on the cards.
BRIC Countries
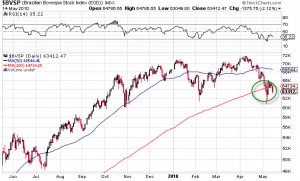
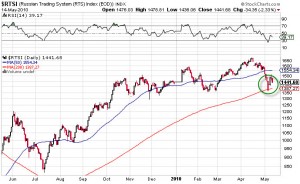
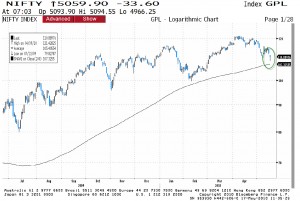
In our April update, we had pointed to the reversal in trend that was underway in the Chinese markets. The Shanghai composite has since tanked over 10% . The technical backdrop in the other three BRIC nations are also dangerously close to breaching an important support. While the Indian Nifty and Russsian RTSI have barely held above their 200 DMA, the Brazilian Bovespa has closed below its 200 DMA.
Bottom Line
The deterioration of technical structure in more and more world indices paints a grim picture of the current market climate. Before we take a more aggressive posturing, we would like to see the Dow theory affirm these signals and only then do we want to believe that we are back to land of bears. Until such time, a conservative approach to the market is warranted.
