Jai

Trade Idea on Frontline Indian Pharma Stock

 Uncategorized  Comments Off on Trade Idea on Frontline Indian Pharma Stock
Apr 042014
 

Dr Reddy's seems to have completed an A-B-C correction and looks set for a new 52 week high. The elliott wave labels are shown on the chart below.

Dr Reddy Daily Charts with Elliott Wave Labels

If you connect the lows from Feb 2013, there is a trendline running through the recent low of 2540. Hence, it makes sense to go long at current levels of 2633 with a daily closing stop below 2540 and expect the stock to scale 2905-3000.

Please bear in mind that in the longer term time frame, we are in the fifth wave. Hence, one should not get aggressive on the long side. Also fifth waves tend to be slower than 3rd wave - something options traders need to be mindful (you may not want time decay eroding your premium despite being right).

Note: If you are a pay-per-view customer, remember to save this post as pdf.

Legal Disclaimer: This post gives an idea of how a trader chooses low risk entry points for trading and hence what you see in this post is for educational purpose only. This is no solicitation to buy, sell or hold any securities. I’m not a registered investment advisor and I strongly urge you to consult one if you are going to act on the above idea. If you decide to take action on the above idea, you are agreeing that you take full responsibility for the profit or loss that you may sustain based on such decisions and agreeing to indemnify the author of the same. You may have seen me on TV suggesting successful trade ideas but remember trading is inherently risky and past performance is no guarantee of future outcome.

NOTE: This was a premium content and has been unlocked now. The trade got stopped out at 2520 on 14th May after reaching 2780 on 30th April.

 Posted by at 10:34 am

Short term trade set up on Reliance Capital

 Uncategorized  Comments Off on Short term trade set up on Reliance Capital
Mar 132014
 

Reliance capital (last -333.8) has clocked a 5 up- 3down price action since its lows in Aug 2013. This is a classic bullish set up under the wave principle. The stock could be at the beginning stages of a huge bullish price move or a large corrective rise. In either case, one may expect a minimum rally to Rs.380. Traders may use Rs.304 at a daily closing level as a stop loss and may use dips to go long in this counter.

Reliance Capital - Daily Charts

Legal Disclaimer: This post gives an idea of how a trader chooses low risk entry points for trading and hence what you see in this post is for educational purpose only. This is no solicitation to buy, sell or hold any securities. I’m not a registered investment advisor and I strongly urge you to consult one if you are going to act on the above idea. If you decide to take action on the above idea, you are agreeing that you take full responsibility for the profit or loss that you may sustain based on such decisions and agreeing to indemnify the author of the same. You may have seen me on TV suggesting successful trade ideas but remember trading is inherently risky and past performance is no guarantee of future outcome.

Note: This was a premium digital content and has now been unlocked as Reliance cap has reached 373

 Posted by at 1:20 am

Technical Analysis GBPINR – short term

 Currency  Comments Off on Technical Analysis GBPINR – short term
Mar 132014
 

The GBPINR cross may have established a base around 100 and seems set to move higher. A small star pattern followed by a bullish candle (similar to a morning star pattern) indicates that higher prices lie ahead. The zig-zag price movements are in harmonic ratios.  This is shown in the chart below. If the cross-rates sustains above 101.82 for an hour, traders may consider going long for an initial target of 103.8 and then 106.3. Use 100.8 at a daily closing level as stop.

GBPINR Daily Charts with Harmonic pattern

Legal Disclaimer: This post gives an idea of how a trader chooses low risk entry points for trading and hence what you see in this post is for educational purpose only. This is no solicitation to buy, sell or hold any securities. I’m not a registered investment advisor and I strongly urge you to consult one if you are going to act on the above idea. If you decide to take action on the above idea, you are agreeing that you take full responsibility for the profit or loss that you may sustain based on such decisions and agreeing to indemnify the author of the same. You may have seen me on TV suggesting successful trade ideas but remember trading is inherently risky and past performance is no guarantee of future outcome.

Note: This was a premium post and has now been unlocked. Trade did not trigger as it did not sustain above 101.82 for an hour.

 Posted by at 1:19 am
Feb 092014
 

It is always a good idea to start from a very significant market turn to get a clear picture of how a market is poised at its current juncture. Hence, we take a look at Bank Nifty from its 2009 low.

Bank Nifty - weekly charts with Elliott Wave Labels

After a close analysis of the weekly charts of Bank Nifty from an Elliott Wave perspective, we are able to label the move from the 2009 low to the 2013 high as a completed 5 wave move. The wave principle tells us that once a 5 wave move is complete, we should look for a 3 wave corrective move against previous trend. This 3 wave move is labeled as an a b c (in circle). Most often this entire corrective wave ends near the previous fourth wave. The blue dashed line on the chart is where the previous 4th wave started and this level corresponds to 7766, which is one possible ending point for this corrective move.

Bank Nifty Daily Charts with Elliott Wave labels

Now lets take a closer look at this corrective move. Drilling down to the daily charts, we are interpreting that at this juncture only Wave a and Wave b are complete and Wave c is underway. Since wave c's are normally a five wave structure, we are interpreting the current decline to be incomplete.

If so far everything has been Greek and Latin, do not worry. What we have to do with these interpretations and wave labels is right ahead. Using the guidelines and rules of wave principle, the key point for us is that, the bounce from 9961 (Feb 4th) on the Bank Nifty is unlikely to touch 10788  as wave iv cannot overlap into wave i and is very likely to end somewhere between (10453-10756).

So what do we do with this information? Once Bank Nifty enters this price zone of 10453-10756, we look to build short positions for the bigger target of 7766 (previous wave 4) or 7200 (where circled wave A would = circled wave C)(Ideally 1/3rd at 10456, 1/3rd at 10600 and 1/3rd at 10750). One can use 10788 itself as a stop but it would be safer to use 11040 as a stop - that is if you are a futures trader. If you are an options trader, one may look to build positions in March 9000 put or the March 9500 put when the Index starts enters zone of 10450-756.

Note: All levels mentioned here are Bank Nifty spot levels and not front month or next month futures levels.

PS: Make sure you save a copy of this report as this is a pay per view report.

Legal Disclaimer: This post gives an idea of how a trader chooses low risk entry points for trading and hence what you see in this post is for educational purpose only. This is no solicitation to buy, sell or hold any securities. I’m not a registered investment advisor and I strongly urge you to consult one if you are going to act on the above idea. If you decide to take action on the above idea, you are agreeing that you take full responsibility for the profit or loss that you may sustain based on such decisions and agreeing to indemnify the author of the same. You may have seen me on TV suggesting successful trade ideas but remember trading is inherently risky and past performance is no guarantee of future outcome.

PS: This was a premium content and has now been unlocked. Trade set up invalidated on a move above 11040.

 Posted by at 9:02 pm
Feb 022014
 

BF Utilities has had a stellar run from low 100's. Under the Elliott Wave model the current decline from 670 to 490 seems to be a wave iv correction. There is a good probability that the low of Friday, 490 marked the end of wave iv. As can be seen from the chart below, I'm interpreting this wave iv as a sub-wave of a large wave 3.

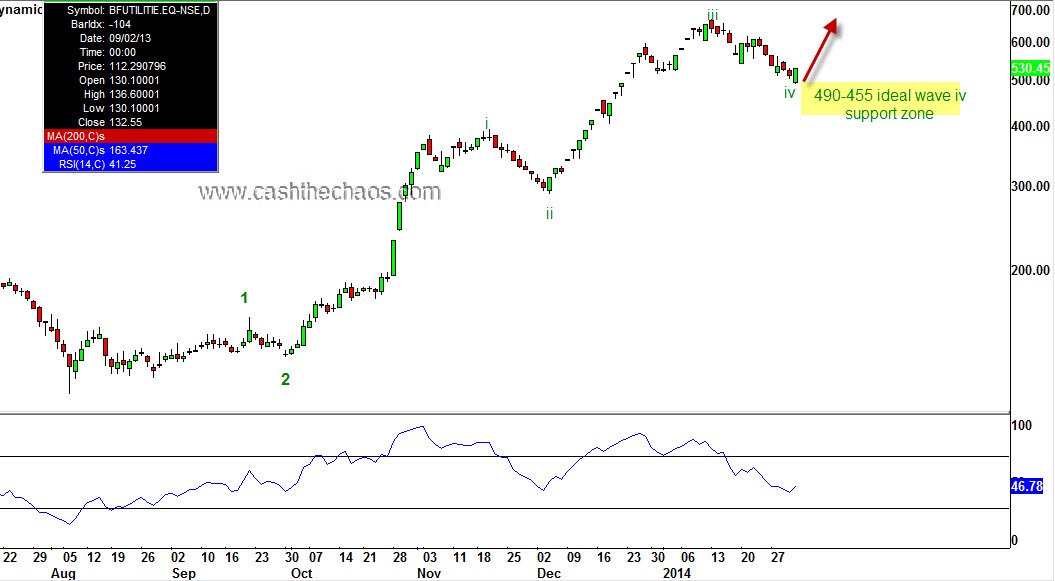
Hence, if we are seeing the beginning of wave v of Wave 3, we are likely to see BF Utility rise to atleast 824 (typical wave v ending point) and ideally 895, as  wave iii was normal and wave v would extend. Eventually, the larger wave 5 would send this stock to north of 1100.

Hence, I would look to create go long on BFUtility, 1/3 to 2/3 of my normal trading size at current levels (530) and look for 895. In the event wave iv is still ongoing, I would look to add balance closer to 490 and 460. Once we see a cross above 620, we can be confident that the move to 895-1100 is underway.

I will email you through updates as to where to place your stop loss orders but at the moment, I do not see BF utility dropping below 460.

Disclosure: I have earlier recommended this to my clients as a multibagger around 300 levels for a target of 1300.

PS: Make sure you save a copy of this report as this is a pay per view report.

Update to post on March 22nd 2014 (via email to subscribers):

536 CMP. LIMIT UP. If you stuck to the original idea, we are currently sitting on a profit of 10%, if you added more during the decline to 431 as per email of 17th, a slighthly higher MTM profit. I suggest booking 1/3 of the qty now. When the stock crosses 605, you can add back this 1/3rd. OR stay in the trade for the rest of the ride with 2/3rd of your position - its all up to you. Remember, always play extreme defence, the profits will roll in.

Update to post on March 17th 2014 (via email to subccribers):

I just want to let you know that despite Friday's weak price action, I see
no change in the longer term price structure. Remember, the original idea
was to buy in stages at 520, 490 and 460. And the confirmation to 800-1100
was only when the stock crossed 605-20. Please re-read the original post.

Great traders always look at minimizing risk. So when the stock moved 10%
in your favour to 590+, you should have taken a bit of profit. If you did
not.... well, we can always learn. Trading is a learning school for a
lifetime.

Coming to the short term structure, we may see a drop to 420-15 before a
bottom is formed. How you manage your risk is in your hands.

Legal Disclaimer: This post gives an idea of how a trader chooses low risk entry points for trading and hence what you see in this post is for educational purpose only. This is no solicitation to buy, sell or hold any securities. I’m not a registered investment advisor and I strongly urge you to consult one if you are going to act on the above idea. If you decide to take action on the above idea, you are agreeing that you take full responsibility for the profit or loss that you may sustain based on such decisions and agreeing to indemnify the author of the same. You may have seen me on TV suggesting successful trade ideas but remember trading is inherently risky and past performance is no guarantee of future outcome.

Note: This was a premium digital content and has now been unlocked after the stock scaled 680 (50% up if one managed the trade as per the post and mail updates)

 Posted by at 11:00 pm

Recent trade ideas

 Uncategorized  Comments Off on Recent trade ideas
Jan 302014
 

Gold:

Were you able to capitilize on the recent wild moves in Gold? We did.  Not only have we got a low risk entry point we have been able to make use of the wild gyrations of the last few days. Here is a screen shot of an update sent to those who purchased the Gold and Silver medium term view:

Gold Update

Gold corrected as expected from 1270's to 1248 and once again bounced from 1248 to 1270.

PNB:

Part of the trade idea was to go long on a just -OTM put. After the report was published, PNB's 560 put appreciated from 5 to 42, 580 put appreciated from 10 to 62 , 8 fold increase and 6 fold increase depending on which strike was taken.

Both these posts - PNB and  precious metals have useful trend guidance that can come in handy for the slightly longer term trader (albeit at a higher risk level now). If you would like to know what are the decision points (targets, key levels, stop loss) and where these securities are headed, click the purchase button( click here for PNB and here for Gold and Silver key words -credit/debit cards and paypal accepted).


 Posted by at 11:46 am

Outlook for Gold and Silver

 Commodities  Comments Off on Outlook for Gold and Silver
Jan 052014
 

The weekly chart of Gold with its Elliott Wave labelling is shown below.

Gold is moving within a large complex 4th wave  and the final 'Y' leg of the 4th wave may have just started.

Besides the June low of 1181, a couple of important Fibonacci support clusters are placed around 1180's. Also, on the day when Gold hit a low of 1186, a survey of futures traders who were bullish on Gold was a mere 5% - an extreme and market lows tend to occur around such sentiment extremes.

Therefore, the odds that Gold has seen an important low at the level of 1181 is quite high. Hence a short term trader may look to go long on Gold with a stop below $1180. Partial longs at current price and pullbacks around 1217-1210 to be used as further entry points. The wave Y is very likely to end close to the August high of Gold, roughly around 1425-30 and that will be the price objective of this trade set up.

Silver:

The technical structure of Silver is similar to that of Gold. Silver is moving within a large complex 4th wave  and the final 'Y' leg of the 4th wave may have just started.

Silver is unlikely to drop below the low of $18.6 seen last week. Hence traders may go long with a stop below 18.6 with a price objective of $25.2. Use decline to $19.7 and $19.5 as entry points with a small entry at current price of $20.2.

PS: There are legitimate alternate Wave Counts for both Gold and Silver but the alternates also point to a short term rally. Mr Market will tell us if we need readjust our wave counts. As of now even the least bullish case, points to a rally of $1350-60 for Gold.

Legal Disclaimer: This post gives an idea of how a trader chooses low risk entry points for trading and hence what you see in this post is for educational purpose only. This is no solicitation to buy, sell or hold any securities. I’m not a registered investment advisor and I strongly urge you to consult one if you are going to act on the above idea. If you decide to take action on the above idea, you are agreeing that you take full responsibility for the profit or loss that you may sustain based on such decisions and agreeing to indemnify the author of the same. You may have seen me on TV suggesting successful trade ideas but remember trading is inherently risky and past performance is no guarantee of future outcome.

PS: This was a premium digital content and has been unlocked now.


 Posted by at 11:41 pm

PNB’s medium term outlook

 Indian Market/Stocks  Comments Off on PNB’s medium term outlook
Jan 052014
 

PNB has gained about 19% since the beginning of December. However, the rise from the September low seems to be just a corrective rise within a larger decline.

The monthly chart of PNB shown below sports a distinctive lower low and lower high pattern. From an Elliott Wave perspective, the decline from 2010 to 2013 September can be counted as waves 1 through 3.

On 2nd Jan the stock reached 654 and then fell sharply to register a bearish outside day. This level of 654 is a perfect 25% retracement of waves 1 through 3 which is a characteristic behavior of wave 4 after a strong wave 3.

On the daily time frame, the move since September is slow, choppy,  overlapping, contained within parallel lines - once again a characteristic behavior of a corrective rally.

Now if we see PNB drop below 600, it is likely that the 5th wave down has started for PNB and a decline to a minimum of 400 is underway. The confidence in this wave count will increase if PNB closes below 558 and also breaks the parallel channel.

So, what would I do as a trader? IF and ONLY if 600 is violated, I would consider going short with 682 cash level as a stop. Ideally using some just out of the money put (should be liquid and have a sensible premium) as a trading vehicle. After, 558 is taken out, I would consider getting more aggressive and hold for the medium term target of 375.

If however 654 is taken out before 600, the broader theme of a 5th wave decline would still be valid but I will let the upward correction continue to about 680-721 before looking to go short. (I will email you all and update in this scenario). The bottom line - medium term outlook is bearish and a move below the September 2013 low seems likely.

Legal Disclaimer: This post gives an idea of how a trader chooses low risk entry points for trading and hence what you see in this post is for educational purpose only. This is no solicitation to buy or sell securities. I'm not a registered investment advisor and if you decide to take action on the above idea, you are agreeing that you take full responsibility for the profit or loss that you may sustain based on such decisions and agreeing to indemnify the author of the same. You may have seen me on TV suggesting successful trade ideas but remember trading is inherently risky and past performance is no guarantee of future outcome.

PS: This was a premium digital content and has been unlocked. The trade setup resulted in partial profit taking on 31st Jan and balance position was stopped at cost on 6th March 2014.

 Posted by at 9:14 pm
Dec 022013
 

Sun pharma has been the best performing stock in the Nifty index for the last 5 years and the trend still seems to be going strong.

The stock is making consistent higher high and higher lows. At the recent low of  562, the stock may have completed a minor wave 4  under the Elliott wave model and a trendline from the year low also passes just below that.  With today's 4% move, the stock is looking like it has started its 5th wave up.

So, it makes enormous sense to place a stop below 560-555 (on a daily closing basis) and go long on this stock. If the wave count is correct, we should see Sun Pharma clock at least 650-674 in the next 2-8 weeks.

If for some reason, the stock drops below 555 on a closing basis, we are wrong and will have to exit the trade at a loss.

Legal Disclaimer: This post gives an idea of how a trader chooses low risk entry points for trading and hence what you see in this post is for educational purpose only. This is no solicitation to buy or sell securities. I'm not a registered investment advisor and if you decide to take action on the above idea, you are agreeing that you take full responsibility for the profit or loss that you may sustain based on such decisions and agreeing to indemnify the author of the same.  You may have seen me on TV suggesting successful trade ideas but remember trading is inherently risky and past performance is no guarantee of future outcome.

 Posted by at 1:48 pm

Dark clouds forming for US Financials sector

 US Markets  Comments Off on Dark clouds forming for US Financials sector
Mar 222013
 

The US markets are at record highs and the financial press is abuzz with calls of "secular bull run" and huge targets for the Dow and S&P. Not entirely unwarranted, I would say. But what are the internals of the markets telling us now? Let us take a look at the financials sector, which outperformed the S&P by a wide margin since the summer of 2012.

The big picture is always a good starting point and here is my Elliott wave count on the long term charts of XLF.

SPDR Financial Sector - Weekly Charts with EW counts

This is my preferred wave count and the price action so far seems to justify this view. The move from the 2009 low looked impulsive and initially warranted us to treat it as an impulse. BUT, the move off the 2012 low is not indicative of a powerful wave 3 (which it should have been if the initial move off 2009 low was an impulse). At least not so far. Also Waves a (blue a) and c (blue c) are related to each other by a typical fibonacci relationship that is indicative of a corrective rally.

Now, let us zoom in on the move off the 2012 lows.

SPDR Financials - Daily Charts with EW Counts

Just eyeballing the waves here, one can easily discern that wave 5 (red 5) is the longest wave. In technical terms, this is called an extended 5th wave. Wave 5 (red 5) measures just a shade over equality to the distance traveled by waves 1 through 3 (red 1-3). The wave principle tells us that is a very common behavior for extended 5th waves. Momentum too has not made fresh highs when price made a high of 18.4 on the 14th of March 2013 (not shown on chart).

Adding all these evidence and taking into account the typical corrective behavior after an extended wave 5, we must not be surprised if XLF gets slotted down quickly to 15.5 from yesterday's close of 18.07 - a potential decline of ATLEAST 15%.

Could I be wrong? Sure. The financials could shoot higher and make me look silly. But, unless one takes a swing at such low risk set up's one cannot score big. Micheal Jordan had to miss 9000 shots in his career to become the greatest basketball player in history. So ago ahead, pull that trigger nevertheless.