Warning signs

 Indian Market/Stocks, US Markets, World Markets  Comments Off on Warning signs
Nov 012019
 

S&p 500:

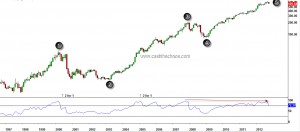
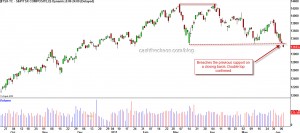
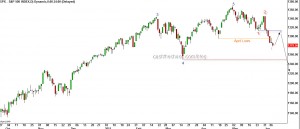
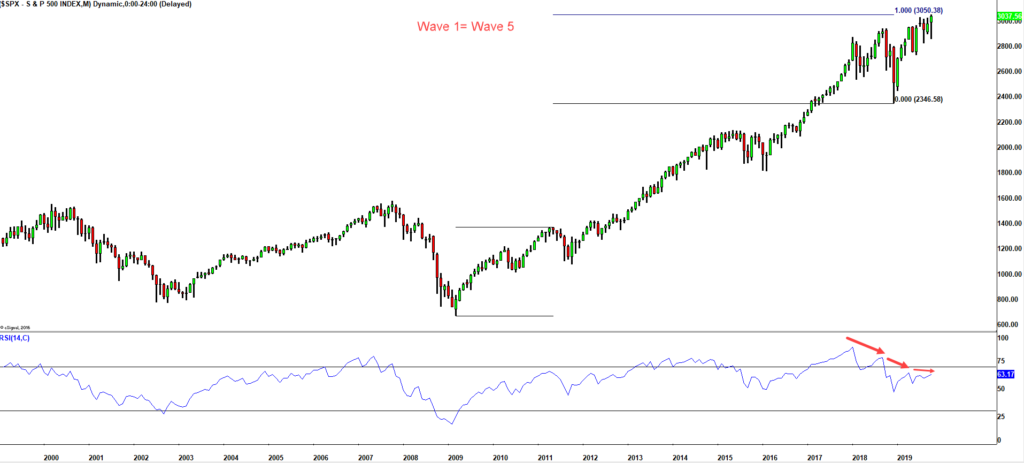
As can be seen from the monthly chart of S&P 500, the momentum for the Index has been dropping precipitously with each new high. (The loss of momentum is pretty much the same on Nasdaq & Dow as well). Under the Elliott Wave Model, I see the move from Dec 2018 as start of the 5th wave for S&P for the bull run that began in 2009. The wave principle states that two of the impulse waves tend towards equality. This is shown in the chart above.

Incidentally, Oct 2019 is 144 months from the high of financial crisis high - a very important Gann number. Invariably, significant highs and low's get registered from previous peaks and troughs (with a very tiny bit of tolerance on either side of this number)

Other Indices:

The Dow Jones Industrial is yet to clock record high. While it's not far off  and it may even clock fresh high in the next couple of days, it is lagging. We can even ignore this but:

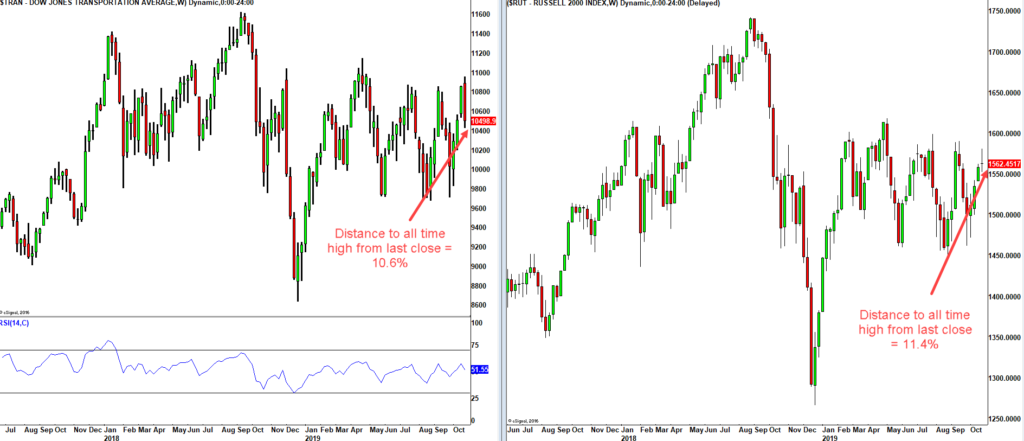
The Dow Transports and the small cap Russell 2000 (shown in the chart above) indices are over 10% from their record highs.

The famous FANG stocks which have been an important cog in this bull run are all lagging. Google while close to its all time high, failed to cross 1290 for the 3rd time. To clock fresh all time high - Netflix needs 45% +, Amazon 15% and Facebook 14%.

Sentiment:

At the record high of 3050 on the S&P reached couple of days back, the sentiment readings are very elevated. The number of futures traders who were bullish reached 80% (courtesy Daily Sentiment Index).  I've seen this reading go to 95% but this is at the extreme zone.

Here is another picture:

As I have shown on the monthly chart of  the S&P,  Wave 1 is right now = Wave 5. A sentiment equality could also be shaping up. In May 2011, Bin Laden was killed by US forces, post that , the S&P dropped 20%. Here just before the 3050 high, Al-Baghdadi has been killed by the US forces. This is once again being hailed as big amelioration of Geo-politcal risks for the market. Will history repeat?

I had spelt some of these thoughts on BQ here:
 Posted by at 4:10 am

Dark clouds forming for US Financials sector

 US Markets  Comments Off on Dark clouds forming for US Financials sector
Mar 222013
 

The US markets are at record highs and the financial press is abuzz with calls of "secular bull run" and huge targets for the Dow and S&P. Not entirely unwarranted, I would say. But what are the internals of the markets telling us now? Let us take a look at the financials sector, which outperformed the S&P by a wide margin since the summer of 2012.

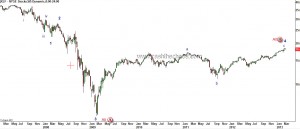
The big picture is always a good starting point and here is my Elliott wave count on the long term charts of XLF.

SPDR Financial Sector - Weekly Charts with EW counts

This is my preferred wave count and the price action so far seems to justify this view. The move from the 2009 low looked impulsive and initially warranted us to treat it as an impulse. BUT, the move off the 2012 low is not indicative of a powerful wave 3 (which it should have been if the initial move off 2009 low was an impulse). At least not so far. Also Waves a (blue a) and c (blue c) are related to each other by a typical fibonacci relationship that is indicative of a corrective rally.

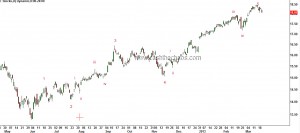
Now, let us zoom in on the move off the 2012 lows.

SPDR Financials - Daily Charts with EW Counts

Just eyeballing the waves here, one can easily discern that wave 5 (red 5) is the longest wave. In technical terms, this is called an extended 5th wave. Wave 5 (red 5) measures just a shade over equality to the distance traveled by waves 1 through 3 (red 1-3). The wave principle tells us that is a very common behavior for extended 5th waves. Momentum too has not made fresh highs when price made a high of 18.4 on the 14th of March 2013 (not shown on chart).

Adding all these evidence and taking into account the typical corrective behavior after an extended wave 5, we must not be surprised if XLF gets slotted down quickly to 15.5 from yesterday's close of 18.07 - a potential decline of ATLEAST 15%.

Could I be wrong? Sure. The financials could shoot higher and make me look silly. But, unless one takes a swing at such low risk set up's one cannot score big. Micheal Jordan had to miss 9000 shots in his career to become the greatest basketball player in history. So ago ahead, pull that trigger nevertheless.

Oct 222012
 

Apple dropped below 623.55 on Friday and that marked a 5 wave decline on a small degree. We know that when a market declines in 5 waves it normally happens to be a  part of a bigger move.

AAPL - 60mins chart, Data and Chart Courtesy Bloomberg

With that in mind, let us look at the bigger picture - the real big picture. As shown in the monthly charts below, it is possible to count 5 waves from the 1997 low. And at the top of wave 5 a clear drop in momentum readings - a disagreement between price and momentum.

Apple Monthly Charts; Data & Charts esignal

Wave 3 on the monthly charts saw a 6 fold increase and wave 5 was little over 3 times wave 1 through 3. The real kicker though is not the price relationship but the time relationship. Wave 3 was 2months longer than 1.618 times wave 1; Wave 4 and wave 2 have a perfect 0.382 Fibonacci relationship; and wave 5 is 0.78 times wave 3!!!

Let us zoom in little more closer - the weekly charts. The 5th wave starting from the 2009 low can be interpreted in a couple of ways.

AAPL weekly charts; Data and Charts - esignal

My interpretation is that the first wave within the 5th was extended. In that case we have a perfect ending relationship - Waves 3+5 are 0.382 times extended wave 1. The momentum divergence here is more pronounced than on the monthly charts.  So there is a good chance that the top 705 was a wave 5 top.

Seeing the above evidence, I lean towards the possibility that AAPL has seen a MASSIVE TOP, a 5th of a 5th. If I'm right, we are possibly looking at AAPL declining to $80 in the next 3-4 years. Either AAPL will burn cash or competition will crush AAPL or some other form of roadblock could be the reason but we are not bothered about the reasons. Reasons will come later. Think such a decline is not possible?  Think Nortel, Juniper, Himachal Futuristic, Satyam to name a few.  Short term: Apple could bounce from sub 600 to 650-674, if it does, I think it will be a low risk selling opportunity.

The broader implication if this analysis is correct - the world is up for some nasty months.

Disclosure: I'm short Apple. I own a couple of Iphones and an Ipad and I will be Queuing up for Apple's mini Ipad.

Sep 122011
 

Some of you have requested my short term view on Nifty and here goes.

Nifty Daily Charts

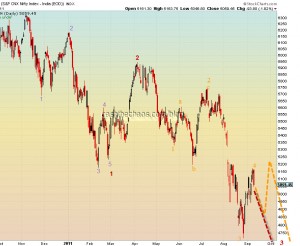
The upward correction that started from 4720 saw some serious selling pressure on Friday. It is possible that this correction may have ended as per the red scenario and a new low may be coming. Alternately, the upward correction may have a little more juice before another new low for the year comes through(orange scenario). So if anyone decides to go short, they need to do be ready with money management strategy around the 4900 zone of Nifty.

While we are here let us also look at the INR charts.

INR daily charts

The pace and steepness of the USD's appreciation against the rupee has all the signs of an impulsive move. You might want to go back and refer to our Aug 26th post on the INR for the bigger picture.

As some of you would have noticed from the comments section, I consider the breakout in the dollar index a significant contributor to the global bear case.

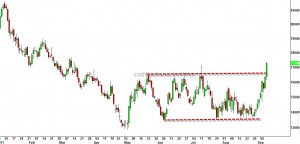
Dollar Index - Daily Charts

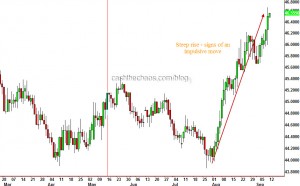
After building a base for 3 months, the dollar index has broken out of a range. This is likely to accentuate the risk aversion across various asset classes.

Given the strength in the dollar index and weakness in rupee - I will not be surprised if a new low comes through in the month of September for equity markets.

PS: Ill be on Bloomberg-UTV today at 8:30 IST.

Aug 252011
 

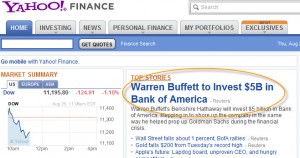
Buffett picks a stake in Bank of America

The BAC management takes a voluntary call from Mr Buffett and agrees to pay 6% on 5 billion for 10years or 300 million a year because they have LOADS and LOADS of capital to spare. YES, I BELIEVE IT, that must be the reason.

 Posted by at 3:26 pm
Jul 192011
 

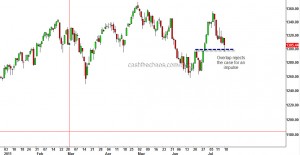
Yesterday's session for the US markets was an important one. If the fall from the May highs was corrective yesterday's low on the S&P 500 should have stayed above 1298. The fact that it did drop to 1296 is an indication the rally from the June lows was possibly an artificial rally manufactured by the powers that be. If you know a little bit of Elliott Wave you would know why this area should not have overlapped.

S&P 500 Daily Chart

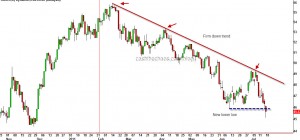
Also the Phily Banking index, nose dived below the June lows.

Philadelphia Banking Index

We already have a Dow theory non-confirmation in July - transports made a new high while the Industrials did not. So if these interpretations are correct, over the next few days we should see further down sides for the S&P which potentially could go below the June low of 1258.

Jun 092011
 

The decline over the past few weeks has started to signal a top in some of the equity markets around the world. The Canadian TSX is one of those.

The chart above shows a confirmed double top for the Canadian TSX composite index. By conventional measuring techniques and by  Elliot wave principle this index should decline to 12300-11000 over the next several weeks from its current level of 13183.

The US S&P's decline below the April low is starting to resemble like the beginning of a powerful third wave. I expect a short-term bounce that relieves the oversold state and gets met with strong supply under 1311 S&P. If that happens expect the lows of  1248 (the post earthquake low ) to give way and the 1173-74 level will draw prices towards it. The next few days are key to this view.

Bottom Line: The global markets structure has started to weaken - The Russsian RTSI after a head and shoulder top in May is declining steadily; the Brazilian Bovespa has been clocking lower tops and lower bottoms since November just like the India Nifty (though this is marginally stronger in relative terms) ; the Shanghai Index too has been taking it on its chin since April.

 Posted by at 7:11 am
Mar 082011
 

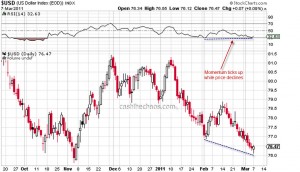
The Dollar index has been on a steady decline since mid-February and is currently one of the least loved asset.  While price has drifted lower, the momentum readings have not matched the price lows.

Dollar Index - Daily Charts

If we went back to the 7th Feb blog post on the Dollar Index (from where there was a small bounce), the Index is trading SLIGTHLY below that medium term trendline. All these line up well for a bear trap. If the currency basket closes above 77.25, I will be brave to venture a long here.

It is also time to have a look at the charts of crude given the amount coverage it has been getting over the last few weeks.

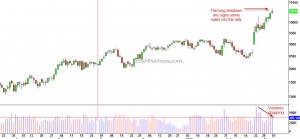
Crude - Daily Charts

While there are no visible signs of exhaustion or reversal here, there are some early warning signs. The volume for these contracts has been dropping over the last few days. If we have a higher close for one or two sessions and then a mild/sharp sell off day, one of my synthetic indicators is likely to flash a sell signal at least for the short-term. The most important signal, I see here is that there is hardly anyone who is NOT BULLISH or does not expect $150-$200 crude. In fact, one famous author of a commodities book, who had been bearish on many commodities including crude is expecting $200 crude now!!!!  Let me warn you here. I'm not trying to say it is time to short crude here. In fact,It is suicidal to out guess the market.  A good trade practice is to be prepared around important pressure points, wait for the reversal and if we have one, evaluate the risk-reward and then pull trigger.

 Posted by at 6:21 am

Dollar Index – another bounce on the cards?

 US Markets  Comments Off on Dollar Index – another bounce on the cards?
Feb 072011
 

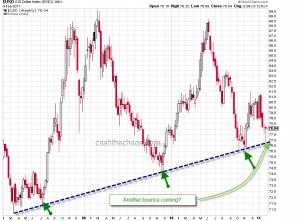
The trendline highlighted on the weekly charts has been a solid support for the Dollar Index despite consistent efforts by the Federal reserve to debase the currency.

Dolla Index - Weekly Charts

An ascent past 78.8-79 would increase the odds of this rally having more legs and clearing the 200 MA( currently placed at 81.61). The much awaited correction for the US markets could be close and those emerging markets stocks which have already been battered (like India) are likely to head even lower.

Dollar Index – Either a bottom is around the corner or a bottom is in place

 US Markets  Comments Off on Dollar Index – Either a bottom is around the corner or a bottom is in place
Nov 092010
 

Dollar Index - Daily Charts

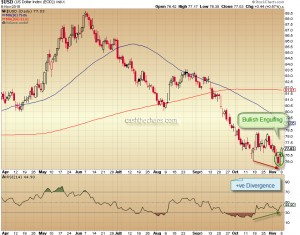
The daily charts of Dollar Index shown above, the drop from October lows to November lows is not matched by a momentum drop. This kind of positive divergence is usually a precursor to a trend change.

Powershares DB US Dollar Index Bullish Fund

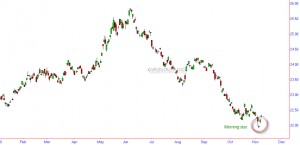
The UUP charts shown above, a morning star candlestick pattern is visible.  When this pattern occurs it is usually a strong reversal sign.

Also, I can count 5 wave decline to the November lows and Sentiment readings from Trade-Futures are pointing to a very extreme level of bearishness for the dollar index (hence bullish from a contrarian  perspective).

So what does all this mean for the other markets? Commodities and stocks closely tied to commodities are very likely to be the immediate victims. The daily correlation for equity markets with the Dollar Index, though varies now and then, currently stands at a range of -ve 0.83(for S&P)to -ve 0.94(for NSE Nifty) i.e. a very high inverse correlation. It is pertinent to note here that such a high inverse correlation existed for equity markets in November 2009 and when the Dollar Index started a powerful rally in December, a correction in equity markets commenced not until January. So a correction or a trend change in equity markets may either be immediate or may start with a slight lag depending on the strength of the anticipated USD rally. Stay cautious and watch how the markets pan out over the next few days.