Jul 192011
 

Yesterday's session for the US markets was an important one. If the fall from the May highs was corrective yesterday's low on the S&P 500 should have stayed above 1298. The fact that it did drop to 1296 is an indication the rally from the June lows was possibly an artificial rally manufactured by the powers that be. If you know a little bit of Elliott Wave you would know why this area should not have overlapped.

S&P 500 Daily Chart

Also the Phily Banking index, nose dived below the June lows.

Philadelphia Banking Index

We already have a Dow theory non-confirmation in July - transports made a new high while the Industrials did not. So if these interpretations are correct, over the next few days we should see further down sides for the S&P which potentially could go below the June low of 1258.

Yet another fakeout?

 Uncategorized  Comments Off on Yet another fakeout?
Sep 242010
 

Yesterday's drop in the S&P 500 below the breakout level of 1129 is once again looking like a failed breakout. As highlighted in my September 2nd post there have been 3 fake out's since June already.

S&P 500 Daily Chart

And each of these fake out's have resulted in a 6-8% move in the opposite direction. As highlighted in the inverse head and shoulder post, the volumes were already looking suspect and this drop back into previous range will give some powder for the bears.  Near term supports at 1105 and 1090 must hold else the risk of yet another swing to 1040/1010 are on the cards.

Wall Street Sequel: Which way for the markets?

 Uncategorized  Comments Off on Wall Street Sequel: Which way for the markets?
Sep 232010
 

Wall street: Money Never Sleeps is getting released in the US today. This is the third movie titled wall street. The first feature film was released in Dec 1929  and the second one ( Chart-buster starring Charlie Sheen and Michael Douglas) was released in Dec 1987. Strangely, markets saw a big crash in 1929 as well as in 1987.  In 1929, after the October crash, markets rallied in a counter-trend for a few month before embarking on the biggest decline in the history of the US markets. However in 1987, the crash of October 1987 marked a major low for the US markets and US markets rallied from there on.

Interestingly, there was a mini crash in May 2010 and there is still a bit of mystery surrounding this crash.  So will the 3rd wall street feature film mean anything for the US markets? Will it be like 1987 0r 1929? While this need not be an indicator of anything but nevertheless will be an interesting theme to watch out for.

Inverse Head & Shoulder breakout

 Uncategorized  Comments Off on Inverse Head & Shoulder breakout
Sep 212010
 

The S&P busted through the resistance level at 1131 and in the process completed the inverse head and shoulder pattern. While conventional measuring techniques provide a price objective of 1250, it is another topic if the S&P can take out the April high of 1220 and would go all the way to reach this price objective. I will try to do a post on this later after some more research.

S&P 500 - Inverse H&S breakout

In my Sept 2nd post, I did alert to the inverse head and shoulder breakout as one of the possible scenario and we also took note of several false breakouts  in the same post. Given that all through July-September the S&P has been rallying on low volume, we should be watchful if the market repeats this choppiness one more time. I'm not saying it will but a good trader is one who is prepared for all scenarios.

US Markets – Is the down trend under risk?

 Uncategorized  Comments Off on US Markets – Is the down trend under risk?
Sep 022010
 

As a trader it's very important that one remains open minded in the market to see the patterns and trends that are evolving. With the S&P surging to one of it's sharpest gains in the last 2 month's, I did try to take a view on markets like someone starting today on a clean slate.

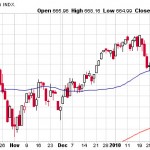
As can be seen from the chart below - there are 2 competing patterns that are trying to overrun each other's lines of defence, namely the bearish head and shoulder pattern(red) and the bullish (potential) inverse head and shoulder pattern (IHS - blue). What is also obvious is that there have been 3 breakouts (circled in orange) that have not seen a follow through.

S&P 500 Daily Charts

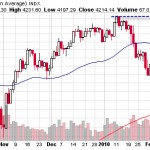
In order to anticipate how this stalemate is likely to resolve, lets try to look at the longer term market structure using Elliott wave analysis.

S&P weekly charts - EW Count

It can be seen that the S&P is still progressing in its fifth wave and is essentially in a down trend. So one should expect this rally to fail somewhere along the way.  Even if the S&P does manage to break out of the IHS neckline at 1131, the probability of it failing under 1220 looks remarkably high. The reason being that the price and time have squared at 1220 high in April and (unless my calculations are wrong ) 1220 is likely to be a multi-year high. Also, a retest of the high of at 1220 would once again be within the template of 1937-38 bear market structure (see April 28th post).

So, I see this as a short term trading opportunity on the long side though I still do not find any overwhelming reasons to be bullish over the medium- long term. Also, my cycle analysis is pointing to a cycle high on the 6th of September (with 1 day tolerance) and I will be watchful to see if the market is coming under pressure under the obvious resistance levels of 1094-1100 and 1131.

PS:  I have looked at the US markets in isolation using the S&P. The SOX is well below its July lows and Russell 2000 has retested its July lows - these under performances are usually good leading indicators.

Jun 302010
 

The Grand Daddy of technical analysis, the Dow Theory,  indicated that the US markets have slipped into a primary down trend - in other words known as a bear market. The Dow Industrials closed below its May trough of 9810, a day after the Dow Transportation Index closed below its May trough of 4034. I'm not even going to bother with the charts as I'm sure the internet is filled with this news.

In this process, US markets have also completed the H&S pattern we highlighted in our June 15th post https://www.cashthechaos.com/blog/?p=261

In the extreme short-term, US markets could be in for a bounce as the Nasdaq has had 8 consecutive down days and the Dow and S&P 7 down days in 8. While such a bounce is not a guarantee, if it occurs, it would be an opportunity to get short and get out of longs positions if any.

Indian markets which have shown tremendous resilience and outperformed world markets so far, may not do so for long.  Expect more intense selling pressure next time Nifty trades below 5259.

One more reason to be bullish

 Uncategorized  Comments Off on One more reason to be bullish
Mar 172010
 

The Dow Theory "buy signal" that was in effect from last July, got another reconfirmation today with the Dow Industrials closing above its January high of 10725. With this, all the three Major US Indices(Dow, S&P and Nasdaq) are clocking higher highs and higher lows thereby implying that the primary up trend that began in March 2009 remains in good health.

While markets might pull-back in the near term, today's move has further increased the odds of Dow Jones Industrial Average scaling 11200. ( I have been holding this view since last July - see my Bloomberg report dated July 24th)

Dollar Index at an interesting juncture

 Uncategorized  Comments Off on Dollar Index at an interesting juncture
Mar 102010
 

Dollar Index's (DXY) December-February rally had once again raised the spectre of deflation and had pinned down the equity markets. The recent rally off the Feb lows in equity markets is interesting, given the fact that the DXY has had a strong inverse correlation with equities since the Lehman collapse and it has hardly retraced off its highs. I had a closer look at the long term technicals and there were a few very interesting data points.

1) If we step back and have a look at the weekly charts over a ten year period the DXY is in an enormous structural bear market. Even a four year old would tell you that the trend is down (Yes, my son did say so).
2) Though the recent rally from 74 to 81 looks like a trend-shift, my preferred weekly wave count, seems to suggest that this could be just a corrective move (wave 4) and a weekly close below 79.7-79.65 could mark the start of next leg in the down trend.
3) The three-legged rise from 74 & change has not even been able to touch the 50% retracement point of the 2008-2009 decline. This is hardly a sign of strength.
4) On March 2nd, the Index failed to clear its Feb highs. A failure at resistance on the first anniversary of topping out often generates a powerful sell signal.

So the recent market action seems to suggest that either the Dollar Index is set for another leg of decline and hence there would be more money chasing all asset classes. Or the inverse correlation that existed between the Index and the Equity markets is coming to an end. Either way, it seems like a win-win situation for the bulls.

Mar 082010


While the Dow Industrials and S&P 500 are yet to take out their 52 week high's the small cap Russell 2000 has scaled above its 52 week high and is holding well above it. This shows that the risk appetite of investors is still alive and kicking. In yesterday's session, the Nasdaq composite too notched a close above its January peak.

Another Index Dow transports, often considered a very good measure of the US economy, is just short of its 52 week high. A new high here will be a shot in the arm for the Bulls.