Dollar Index's (DXY) December-February rally had once again raised the spectre of deflation and had pinned down the equity markets. The recent rally off the Feb lows in equity markets is interesting, given the fact that the DXY has had a strong inverse correlation with equities since the Lehman collapse and it has hardly retraced off its highs. I had a closer look at the long term technicals and there were a few very interesting data points.


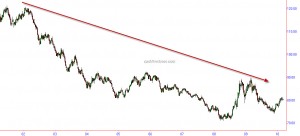
1) If we step back and have a look at the weekly charts over a ten year period the DXY is in an enormous structural bear market. Even a four year old would tell you that the trend is down (Yes, my son did say so).
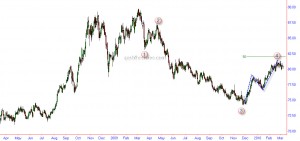
2) Though the recent rally from 74 to 81 looks like a trend-shift, my preferred weekly wave count, seems to suggest that this could be just a corrective move (wave 4) and a weekly close below 79.7-79.65 could mark the start of next leg in the down trend.
3) The three-legged rise from 74 & change has not even been able to touch the 50% retracement point of the 2008-2009 decline. This is hardly a sign of strength.
4) On March 2nd, the Index failed to clear its Feb highs. A failure at resistance on the first anniversary of topping out often generates a powerful sell signal.
So the recent market action seems to suggest that either the Dollar Index is set for another leg of decline and hence there would be more money chasing all asset classes. Or the inverse correlation that existed between the Index and the Equity markets is coming to an end. Either way, it seems like a win-win situation for the bulls.
Sorry, the comment form is closed at this time.