Warning signs

 Indian Market/Stocks, US Markets, World Markets  Comments Off on Warning signs
Nov 012019
 

S&p 500:

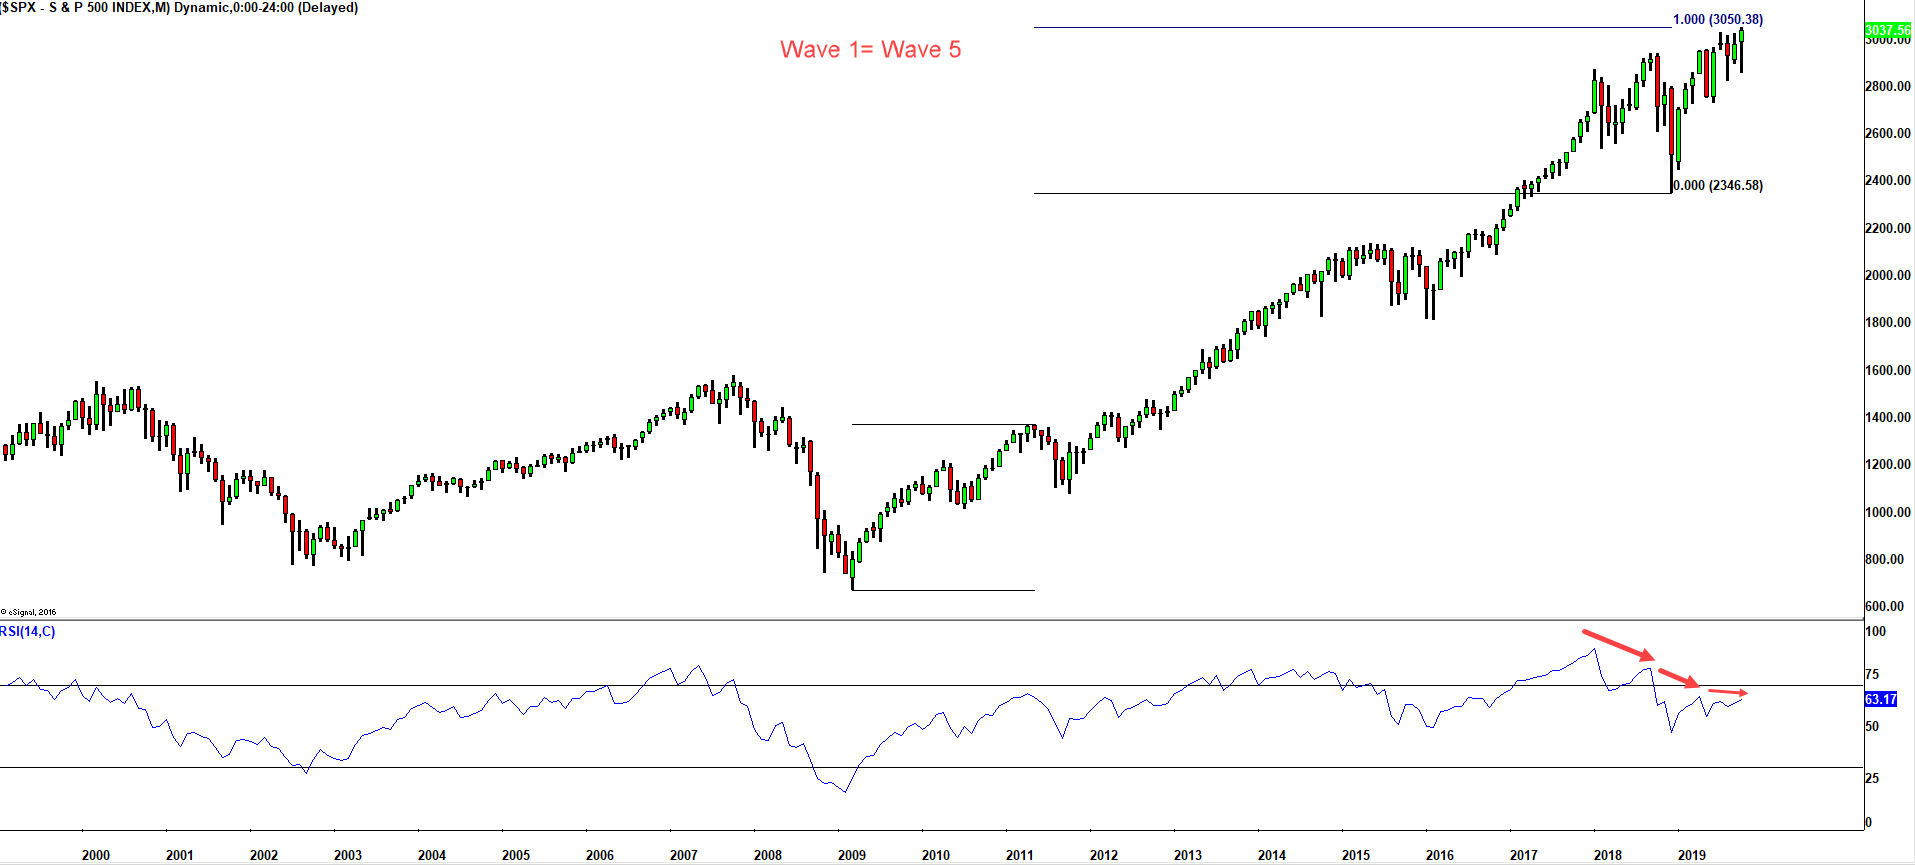
As can be seen from the monthly chart of S&P 500, the momentum for the Index has been dropping precipitously with each new high. (The loss of momentum is pretty much the same on Nasdaq & Dow as well). Under the Elliott Wave Model, I see the move from Dec 2018 as start of the 5th wave for S&P for the bull run that began in 2009. The wave principle states that two of the impulse waves tend towards equality. This is shown in the chart above.

Incidentally, Oct 2019 is 144 months from the high of financial crisis high - a very important Gann number. Invariably, significant highs and low's get registered from previous peaks and troughs (with a very tiny bit of tolerance on either side of this number)

Other Indices:

The Dow Jones Industrial is yet to clock record high. While it's not far off  and it may even clock fresh high in the next couple of days, it is lagging. We can even ignore this but:

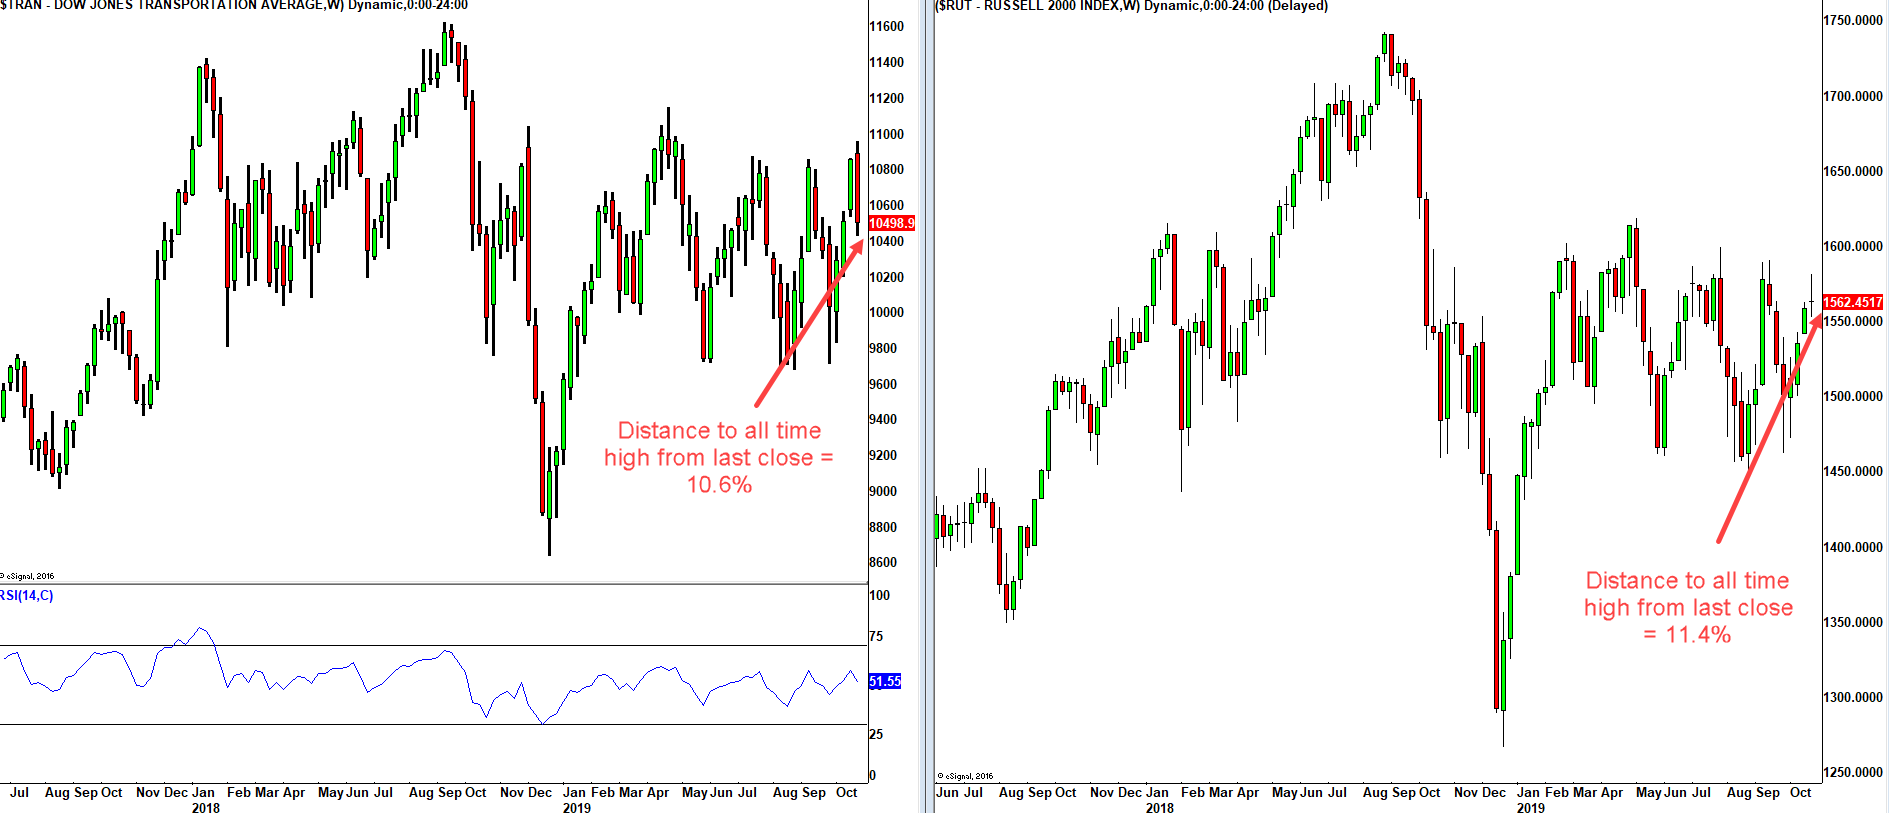
The Dow Transports and the small cap Russell 2000 (shown in the chart above) indices are over 10% from their record highs.

The famous FANG stocks which have been an important cog in this bull run are all lagging. Google while close to its all time high, failed to cross 1290 for the 3rd time. To clock fresh all time high - Netflix needs 45% +, Amazon 15% and Facebook 14%.

Sentiment:

At the record high of 3050 on the S&P reached couple of days back, the sentiment readings are very elevated. The number of futures traders who were bullish reached 80% (courtesy Daily Sentiment Index).  I've seen this reading go to 95% but this is at the extreme zone.

Here is another picture:

As I have shown on the monthly chart of  the S&P,  Wave 1 is right now = Wave 5. A sentiment equality could also be shaping up. In May 2011, Bin Laden was killed by US forces, post that , the S&P dropped 20%. Here just before the 3050 high, Al-Baghdadi has been killed by the US forces. This is once again being hailed as big amelioration of Geo-politcal risks for the market. Will history repeat?

I had spelt some of these thoughts on BQ here:

 Posted by at 4:10 am
Sep 292019
 

Indian equities have had an interesting 6 sessions of trade. The Sensex dropped below the Aug low while the Nifty barely managed to hold above the Aug low.

Chart 1: Nifty vs SensexNifty's price action of the last week has thrown up a couple of possibilities.

(a) Bull case:  My interpretation that the Index registered a major top in June 2019 was premature. OR

(b) Bear case: A major top is in place and the events of last week simply interrupted the decline.

If we consider (b) as the case, that leaves us with two possibilities. Either the index hasn't got much upside beyond the 11700-750 ball park or the index is going to fail just under the record high of 12103.

This leaves us with a couple of interpretation under the Elliott Wave model and in both cases, the bounce is a correction. Did the correction start from August low as an irregular correction or did the markets see a 'truncation' in September due to an unforeseen event is the question to be answered. (For those who want to get technical under EW, the decline from 12103 ended a five step minor degree A or 1 at the Aug/Sep low and markets are on a corrective minor degree 2 or B)

The important takeaway from this is that we need to be on guard - Indian equities could reverse suddenly without much warning as the upside could be done or very limited.

If we consider the case (a), the reasonable and sensible way to interpret the price action seems to be an ending contracting diagonal under the Elliott Wave model. Under this interpretation, the upsides are a little bit better but doesn't seem like one should build a big portfolio expecting a multi-year upside. The upsides may not last beyond a few weeks to a few months.

Chart 2: Nifty Weekly 3-3-3-3-3 ending diagonal

Bottom Line: To me, it makes eminent sense to wear a trader's hat and not an investor's hat.

 Posted by at 3:38 pm

Buffett’s Gold bashing is misplaced… once again

 Commodities  Comments Off on Buffett’s Gold bashing is misplaced… once again
May 092018
 

At Berkshire Hathaway’s annual meeting 2018 this weekend, Warren Buffett revealed that $10,000 invested in an S&P 500 index fund in 1942 (there were none at the time, he noted) would be worth $51 million today. However, $10,000 invested in Gold would be approximately $400,000. (This is not the first time Mr Buffett has taken a potshot at Gold, he did the same back in 2012 and I had a blog post https://www.cashthechaos.com/blog/2012/02/17/gold-the-buffett-slayer/)

When one is a Billionaire, one can say whatever one wants and try to pass it as wisdom or gospel truth. Let us examine these words of Avuncular Warren a little closer.

First, as Mr Buffett has rightly noted, there were no index funds back in 1942. What is unsaid and absolutely critical is that the first index fund was not around until the 1970's. So an investor would have needed all the sophistication to track the key stocks by market value, assign/reassign weights, balance/re-balance the portfolio and all that jazz that an index fund or an ETF does these days.  Remember, at its 50th anniversary of formation, the S&P500 had just about 80 odd of the original 500, and the 400+ companies had either gone bankrupt, been taken over or dropped off the index. So for 30 years! Was a normal investor expected to do that? How do you think that would have gone? Marquee Company's like Sears, Lehman, Radio Shack which were on the index for 50+ years went bust. Bear in mind, that when an investor looses 10% he/she needs 11.2% to break-even, 25% loss needs 33% to break-even and so on.

Second, it is very very important in the present world of QE, to understand what exactly is a Dollar. Only then can one understand the true value of the $51 million Mr Buffett is talking about. For millennia, real money was backed by tangible goods. Gold and Silver served this purpose. We know from history that President Roosevelt in 1933 and President Nixon in 1971 obliterated the US$ from being honest money. So what exactly is a Dollar backed by? Government bonds. Which is nothing but a promise to pay dollars. A promise on a promise and nothing tangible. Does "I promise to pay the bearer a sum of Rupees..." ring a bell? (And the central bankers call Crypto currencies as a scam!! )

What is a Dollar then? The US Congress describes the Dollar as 1/44.22 an ounce of Gold. That is if you pay $44.22 you can get an ounce or 28.35 gms of gold OR 1kg of gold for $1,560!!  Compare that to actual value of 1kg of gold as on date - $ 42,346!!

Now, why don't someone try taking these fiat dollars to the Treasury or the Fed and try to exchange it for 1kg gold per $1,560? After all these notes are the obligations of the United States of America. You would probably be dispossessed of your money and sent to a mental institution. The dollar had such value once upon a time. Today it has lost somewhere between 85% to 97% of it's value  - don't take my word, pull out the data from Federal Reserve and see for yourself. (From the St Louis Federal Reserve, Title: Board of Governors Monetary Base, Not Adjusted for Changes in Reserve Requirements, Series ID: BOGUMBNS, Source: Board of Governors of the Federal Reserve System, Release: H.3 Aggregate Reserves of Depository Institutions and the Monetary Base)

It is exactly this kind of dilution and dishonesty that Gold stands to protect. And it has. An ounce of gold will fetch a fine Louis Vitton or Hugo Boss suit.

Finally, here is a chart of Gold's performance vs Berkshire Hathway since 2002.

In 2012, gold was crushing the performance of BRK by 420%. Also one can see, Gold is still delivering 70% better returns than BRK since 2002, even after a steep drop from record highs. Buffett's BRK has completely missed the commodity boom. Hence, maybe he has a reputation guard?

Also, Berkshire has a cash reserve of over $100Bln. This reserve needs to go into something productive otherwise this poses a big problem for Buffett, especially if the dollar is going to loose value in the future.


 Posted by at 3:35 am

Trade Idea on Frontline Indian Pharma Stock

 Uncategorized  Comments Off on Trade Idea on Frontline Indian Pharma Stock
Apr 042014
 

Dr Reddy's seems to have completed an A-B-C correction and looks set for a new 52 week high. The elliott wave labels are shown on the chart below.

Dr Reddy Daily Charts with Elliott Wave Labels

If you connect the lows from Feb 2013, there is a trendline running through the recent low of 2540. Hence, it makes sense to go long at current levels of 2633 with a daily closing stop below 2540 and expect the stock to scale 2905-3000.

Please bear in mind that in the longer term time frame, we are in the fifth wave. Hence, one should not get aggressive on the long side. Also fifth waves tend to be slower than 3rd wave - something options traders need to be mindful (you may not want time decay eroding your premium despite being right).

Note: If you are a pay-per-view customer, remember to save this post as pdf.

Legal Disclaimer: This post gives an idea of how a trader chooses low risk entry points for trading and hence what you see in this post is for educational purpose only. This is no solicitation to buy, sell or hold any securities. I’m not a registered investment advisor and I strongly urge you to consult one if you are going to act on the above idea. If you decide to take action on the above idea, you are agreeing that you take full responsibility for the profit or loss that you may sustain based on such decisions and agreeing to indemnify the author of the same. You may have seen me on TV suggesting successful trade ideas but remember trading is inherently risky and past performance is no guarantee of future outcome.

NOTE: This was a premium content and has been unlocked now. The trade got stopped out at 2520 on 14th May after reaching 2780 on 30th April.

 Posted by at 10:34 am

Short term trade set up on Reliance Capital

 Uncategorized  Comments Off on Short term trade set up on Reliance Capital
Mar 132014
 

Reliance capital (last -333.8) has clocked a 5 up- 3down price action since its lows in Aug 2013. This is a classic bullish set up under the wave principle. The stock could be at the beginning stages of a huge bullish price move or a large corrective rise. In either case, one may expect a minimum rally to Rs.380. Traders may use Rs.304 at a daily closing level as a stop loss and may use dips to go long in this counter.

Reliance Capital - Daily Charts

Legal Disclaimer: This post gives an idea of how a trader chooses low risk entry points for trading and hence what you see in this post is for educational purpose only. This is no solicitation to buy, sell or hold any securities. I’m not a registered investment advisor and I strongly urge you to consult one if you are going to act on the above idea. If you decide to take action on the above idea, you are agreeing that you take full responsibility for the profit or loss that you may sustain based on such decisions and agreeing to indemnify the author of the same. You may have seen me on TV suggesting successful trade ideas but remember trading is inherently risky and past performance is no guarantee of future outcome.

Note: This was a premium digital content and has now been unlocked as Reliance cap has reached 373

 Posted by at 1:20 am

Technical Analysis GBPINR – short term

 Currency  Comments Off on Technical Analysis GBPINR – short term
Mar 132014
 

The GBPINR cross may have established a base around 100 and seems set to move higher. A small star pattern followed by a bullish candle (similar to a morning star pattern) indicates that higher prices lie ahead. The zig-zag price movements are in harmonic ratios.  This is shown in the chart below. If the cross-rates sustains above 101.82 for an hour, traders may consider going long for an initial target of 103.8 and then 106.3. Use 100.8 at a daily closing level as stop.

GBPINR Daily Charts with Harmonic pattern

Legal Disclaimer: This post gives an idea of how a trader chooses low risk entry points for trading and hence what you see in this post is for educational purpose only. This is no solicitation to buy, sell or hold any securities. I’m not a registered investment advisor and I strongly urge you to consult one if you are going to act on the above idea. If you decide to take action on the above idea, you are agreeing that you take full responsibility for the profit or loss that you may sustain based on such decisions and agreeing to indemnify the author of the same. You may have seen me on TV suggesting successful trade ideas but remember trading is inherently risky and past performance is no guarantee of future outcome.

Note: This was a premium post and has now been unlocked. Trade did not trigger as it did not sustain above 101.82 for an hour.

 Posted by at 1:19 am
Feb 092014
 

It is always a good idea to start from a very significant market turn to get a clear picture of how a market is poised at its current juncture. Hence, we take a look at Bank Nifty from its 2009 low.

Bank Nifty - weekly charts with Elliott Wave Labels

After a close analysis of the weekly charts of Bank Nifty from an Elliott Wave perspective, we are able to label the move from the 2009 low to the 2013 high as a completed 5 wave move. The wave principle tells us that once a 5 wave move is complete, we should look for a 3 wave corrective move against previous trend. This 3 wave move is labeled as an a b c (in circle). Most often this entire corrective wave ends near the previous fourth wave. The blue dashed line on the chart is where the previous 4th wave started and this level corresponds to 7766, which is one possible ending point for this corrective move.

Bank Nifty Daily Charts with Elliott Wave labels

Now lets take a closer look at this corrective move. Drilling down to the daily charts, we are interpreting that at this juncture only Wave a and Wave b are complete and Wave c is underway. Since wave c's are normally a five wave structure, we are interpreting the current decline to be incomplete.

If so far everything has been Greek and Latin, do not worry. What we have to do with these interpretations and wave labels is right ahead. Using the guidelines and rules of wave principle, the key point for us is that, the bounce from 9961 (Feb 4th) on the Bank Nifty is unlikely to touch 10788  as wave iv cannot overlap into wave i and is very likely to end somewhere between (10453-10756).

So what do we do with this information? Once Bank Nifty enters this price zone of 10453-10756, we look to build short positions for the bigger target of 7766 (previous wave 4) or 7200 (where circled wave A would = circled wave C)(Ideally 1/3rd at 10456, 1/3rd at 10600 and 1/3rd at 10750). One can use 10788 itself as a stop but it would be safer to use 11040 as a stop - that is if you are a futures trader. If you are an options trader, one may look to build positions in March 9000 put or the March 9500 put when the Index starts enters zone of 10450-756.

Note: All levels mentioned here are Bank Nifty spot levels and not front month or next month futures levels.

PS: Make sure you save a copy of this report as this is a pay per view report.

Legal Disclaimer: This post gives an idea of how a trader chooses low risk entry points for trading and hence what you see in this post is for educational purpose only. This is no solicitation to buy, sell or hold any securities. I’m not a registered investment advisor and I strongly urge you to consult one if you are going to act on the above idea. If you decide to take action on the above idea, you are agreeing that you take full responsibility for the profit or loss that you may sustain based on such decisions and agreeing to indemnify the author of the same. You may have seen me on TV suggesting successful trade ideas but remember trading is inherently risky and past performance is no guarantee of future outcome.

PS: This was a premium content and has now been unlocked. Trade set up invalidated on a move above 11040.

 Posted by at 9:02 pm
Feb 022014
 

BF Utilities has had a stellar run from low 100's. Under the Elliott Wave model the current decline from 670 to 490 seems to be a wave iv correction. There is a good probability that the low of Friday, 490 marked the end of wave iv. As can be seen from the chart below, I'm interpreting this wave iv as a sub-wave of a large wave 3.

Hence, if we are seeing the beginning of wave v of Wave 3, we are likely to see BF Utility rise to atleast 824 (typical wave v ending point) and ideally 895, as  wave iii was normal and wave v would extend. Eventually, the larger wave 5 would send this stock to north of 1100.

Hence, I would look to create go long on BFUtility, 1/3 to 2/3 of my normal trading size at current levels (530) and look for 895. In the event wave iv is still ongoing, I would look to add balance closer to 490 and 460. Once we see a cross above 620, we can be confident that the move to 895-1100 is underway.

I will email you through updates as to where to place your stop loss orders but at the moment, I do not see BF utility dropping below 460.

Disclosure: I have earlier recommended this to my clients as a multibagger around 300 levels for a target of 1300.

PS: Make sure you save a copy of this report as this is a pay per view report.

Update to post on March 22nd 2014 (via email to subscribers):

536 CMP. LIMIT UP. If you stuck to the original idea, we are currently sitting on a profit of 10%, if you added more during the decline to 431 as per email of 17th, a slighthly higher MTM profit. I suggest booking 1/3 of the qty now. When the stock crosses 605, you can add back this 1/3rd. OR stay in the trade for the rest of the ride with 2/3rd of your position - its all up to you. Remember, always play extreme defence, the profits will roll in.

Update to post on March 17th 2014 (via email to subccribers):

I just want to let you know that despite Friday's weak price action, I see
no change in the longer term price structure. Remember, the original idea
was to buy in stages at 520, 490 and 460. And the confirmation to 800-1100
was only when the stock crossed 605-20. Please re-read the original post.

Great traders always look at minimizing risk. So when the stock moved 10%
in your favour to 590+, you should have taken a bit of profit. If you did
not.... well, we can always learn. Trading is a learning school for a
lifetime.

Coming to the short term structure, we may see a drop to 420-15 before a
bottom is formed. How you manage your risk is in your hands.

Legal Disclaimer: This post gives an idea of how a trader chooses low risk entry points for trading and hence what you see in this post is for educational purpose only. This is no solicitation to buy, sell or hold any securities. I’m not a registered investment advisor and I strongly urge you to consult one if you are going to act on the above idea. If you decide to take action on the above idea, you are agreeing that you take full responsibility for the profit or loss that you may sustain based on such decisions and agreeing to indemnify the author of the same. You may have seen me on TV suggesting successful trade ideas but remember trading is inherently risky and past performance is no guarantee of future outcome.

Note: This was a premium digital content and has now been unlocked after the stock scaled 680 (50% up if one managed the trade as per the post and mail updates)

 Posted by at 11:00 pm

Recent trade ideas

 Uncategorized  Comments Off on Recent trade ideas
Jan 302014
 

Gold:

Were you able to capitilize on the recent wild moves in Gold? We did.  Not only have we got a low risk entry point we have been able to make use of the wild gyrations of the last few days. Here is a screen shot of an update sent to those who purchased the Gold and Silver medium term view:

Gold Update

Gold corrected as expected from 1270's to 1248 and once again bounced from 1248 to 1270.

PNB:

Part of the trade idea was to go long on a just -OTM put. After the report was published, PNB's 560 put appreciated from 5 to 42, 580 put appreciated from 10 to 62 , 8 fold increase and 6 fold increase depending on which strike was taken.

Both these posts - PNB and  precious metals have useful trend guidance that can come in handy for the slightly longer term trader (albeit at a higher risk level now). If you would like to know what are the decision points (targets, key levels, stop loss) and where these securities are headed, click the purchase button( click here for PNB and here for Gold and Silver key words -credit/debit cards and paypal accepted).


 Posted by at 11:46 am

Outlook for Gold and Silver

 Commodities  Comments Off on Outlook for Gold and Silver
Jan 052014
 

The weekly chart of Gold with its Elliott Wave labelling is shown below.

Gold is moving within a large complex 4th wave  and the final 'Y' leg of the 4th wave may have just started.

Besides the June low of 1181, a couple of important Fibonacci support clusters are placed around 1180's. Also, on the day when Gold hit a low of 1186, a survey of futures traders who were bullish on Gold was a mere 5% - an extreme and market lows tend to occur around such sentiment extremes.

Therefore, the odds that Gold has seen an important low at the level of 1181 is quite high. Hence a short term trader may look to go long on Gold with a stop below $1180. Partial longs at current price and pullbacks around 1217-1210 to be used as further entry points. The wave Y is very likely to end close to the August high of Gold, roughly around 1425-30 and that will be the price objective of this trade set up.

Silver:

The technical structure of Silver is similar to that of Gold. Silver is moving within a large complex 4th wave  and the final 'Y' leg of the 4th wave may have just started.

Silver is unlikely to drop below the low of $18.6 seen last week. Hence traders may go long with a stop below 18.6 with a price objective of $25.2. Use decline to $19.7 and $19.5 as entry points with a small entry at current price of $20.2.

PS: There are legitimate alternate Wave Counts for both Gold and Silver but the alternates also point to a short term rally. Mr Market will tell us if we need readjust our wave counts. As of now even the least bullish case, points to a rally of $1350-60 for Gold.

Legal Disclaimer: This post gives an idea of how a trader chooses low risk entry points for trading and hence what you see in this post is for educational purpose only. This is no solicitation to buy, sell or hold any securities. I’m not a registered investment advisor and I strongly urge you to consult one if you are going to act on the above idea. If you decide to take action on the above idea, you are agreeing that you take full responsibility for the profit or loss that you may sustain based on such decisions and agreeing to indemnify the author of the same. You may have seen me on TV suggesting successful trade ideas but remember trading is inherently risky and past performance is no guarantee of future outcome.

PS: This was a premium digital content and has been unlocked now.


 Posted by at 11:41 pm