PNB’s medium term outlook

 Indian Market/Stocks  Comments Off on PNB’s medium term outlook
Jan 052014
 

PNB has gained about 19% since the beginning of December. However, the rise from the September low seems to be just a corrective rise within a larger decline.

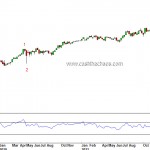
The monthly chart of PNB shown below sports a distinctive lower low and lower high pattern. From an Elliott Wave perspective, the decline from 2010 to 2013 September can be counted as waves 1 through 3.
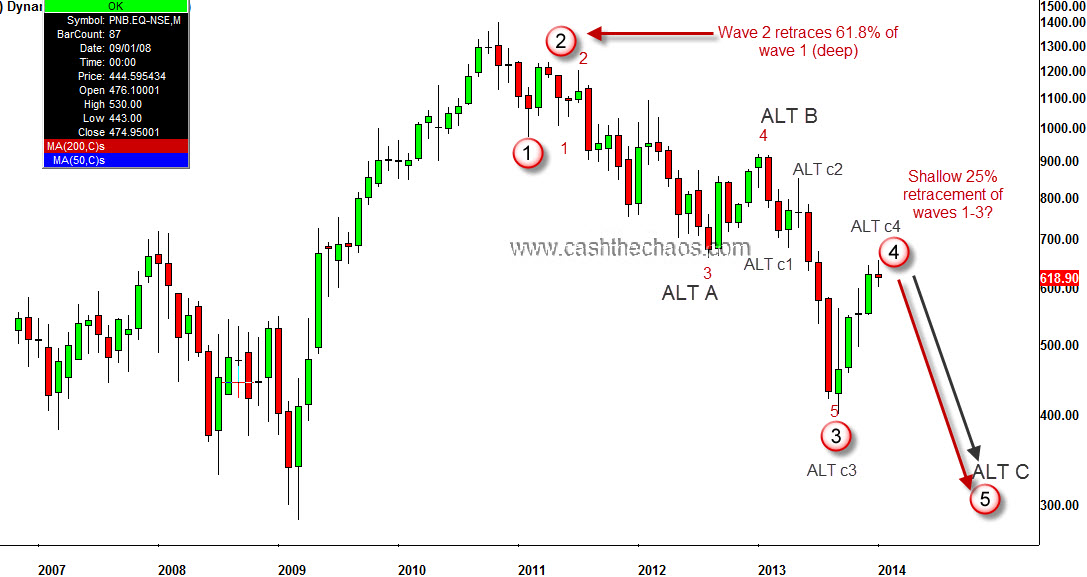
On 2nd Jan the stock reached 654 and then fell sharply to register a bearish outside day. This level of 654 is a perfect 25% retracement of waves 1 through 3 which is a characteristic behavior of wave 4 after a strong wave 3.

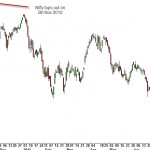
On the daily time frame, the move since September is slow, choppy,  overlapping, contained within parallel lines - once again a characteristic behavior of a corrective rally.
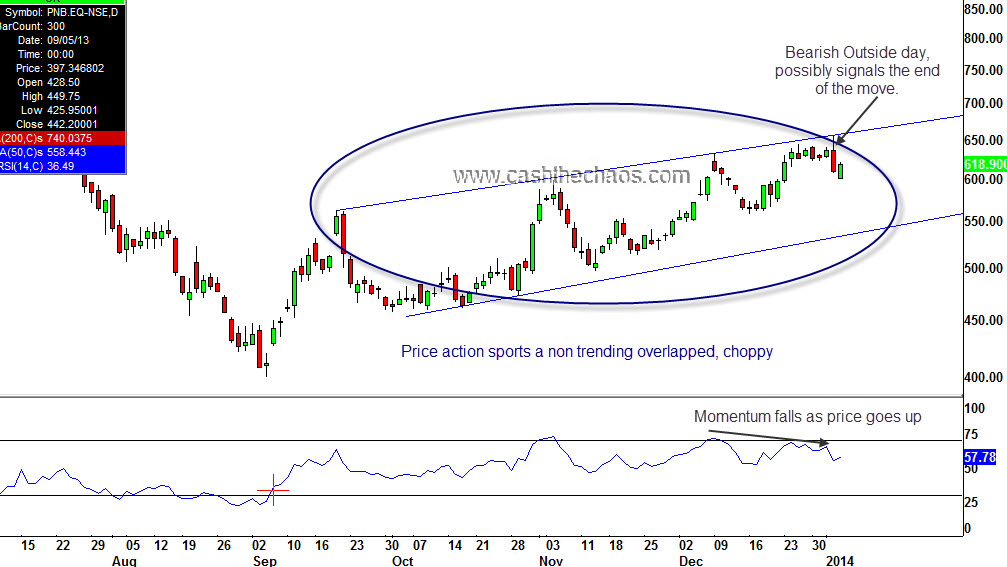
Now if we see PNB drop below 600, it is likely that the 5th wave down has started for PNB and a decline to a minimum of 400 is underway. The confidence in this wave count will increase if PNB closes below 558 and also breaks the parallel channel.

So, what would I do as a trader? IF and ONLY if 600 is violated, I would consider going short with 682 cash level as a stop. Ideally using some just out of the money put (should be liquid and have a sensible premium) as a trading vehicle. After, 558 is taken out, I would consider getting more aggressive and hold for the medium term target of 375.

If however 654 is taken out before 600, the broader theme of a 5th wave decline would still be valid but I will let the upward correction continue to about 680-721 before looking to go short. (I will email you all and update in this scenario). The bottom line - medium term outlook is bearish and a move below the September 2013 low seems likely.

Legal Disclaimer: This post gives an idea of how a trader chooses low risk entry points for trading and hence what you see in this post is for educational purpose only. This is no solicitation to buy or sell securities. I'm not a registered investment advisor and if you decide to take action on the above idea, you are agreeing that you take full responsibility for the profit or loss that you may sustain based on such decisions and agreeing to indemnify the author of the same. You may have seen me on TV suggesting successful trade ideas but remember trading is inherently risky and past performance is no guarantee of future outcome.

PS: This was a premium digital content and has been unlocked. The trade setup resulted in partial profit taking on 31st Jan and balance position was stopped at cost on 6th March 2014.
 Posted by at 9:14 pm
Dec 022013
 

Sun pharma has been the best performing stock in the Nifty index for the last 5 years and the trend still seems to be going strong.

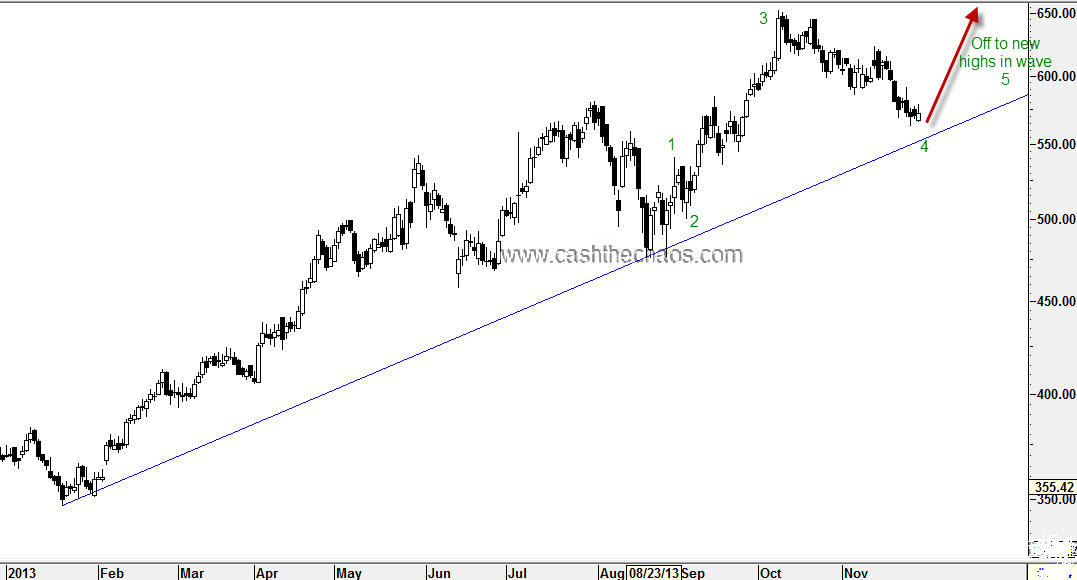
The stock is making consistent higher high and higher lows. At the recent low of  562, the stock may have completed a minor wave 4  under the Elliott wave model and a trendline from the year low also passes just below that.  With today's 4% move, the stock is looking like it has started its 5th wave up.

So, it makes enormous sense to place a stop below 560-555 (on a daily closing basis) and go long on this stock. If the wave count is correct, we should see Sun Pharma clock at least 650-674 in the next 2-8 weeks.

If for some reason, the stock drops below 555 on a closing basis, we are wrong and will have to exit the trade at a loss.

Legal Disclaimer: This post gives an idea of how a trader chooses low risk entry points for trading and hence what you see in this post is for educational purpose only. This is no solicitation to buy or sell securities. I'm not a registered investment advisor and if you decide to take action on the above idea, you are agreeing that you take full responsibility for the profit or loss that you may sustain based on such decisions and agreeing to indemnify the author of the same.  You may have seen me on TV suggesting successful trade ideas but remember trading is inherently risky and past performance is no guarantee of future outcome.

 Posted by at 1:48 pm

Dark clouds forming for US Financials sector

 US Markets  Comments Off on Dark clouds forming for US Financials sector
Mar 222013
 

The US markets are at record highs and the financial press is abuzz with calls of "secular bull run" and huge targets for the Dow and S&P. Not entirely unwarranted, I would say. But what are the internals of the markets telling us now? Let us take a look at the financials sector, which outperformed the S&P by a wide margin since the summer of 2012.

The big picture is always a good starting point and here is my Elliott wave count on the long term charts of XLF.

SPDR Financial Sector - Weekly Charts with EW counts

This is my preferred wave count and the price action so far seems to justify this view. The move from the 2009 low looked impulsive and initially warranted us to treat it as an impulse. BUT, the move off the 2012 low is not indicative of a powerful wave 3 (which it should have been if the initial move off 2009 low was an impulse). At least not so far. Also Waves a (blue a) and c (blue c) are related to each other by a typical fibonacci relationship that is indicative of a corrective rally.

Now, let us zoom in on the move off the 2012 lows.

SPDR Financials - Daily Charts with EW Counts

Just eyeballing the waves here, one can easily discern that wave 5 (red 5) is the longest wave. In technical terms, this is called an extended 5th wave. Wave 5 (red 5) measures just a shade over equality to the distance traveled by waves 1 through 3 (red 1-3). The wave principle tells us that is a very common behavior for extended 5th waves. Momentum too has not made fresh highs when price made a high of 18.4 on the 14th of March 2013 (not shown on chart).

Adding all these evidence and taking into account the typical corrective behavior after an extended wave 5, we must not be surprised if XLF gets slotted down quickly to 15.5 from yesterday's close of 18.07 - a potential decline of ATLEAST 15%.

Could I be wrong? Sure. The financials could shoot higher and make me look silly. But, unless one takes a swing at such low risk set up's one cannot score big. Micheal Jordan had to miss 9000 shots in his career to become the greatest basketball player in history. So ago ahead, pull that trigger nevertheless.

Prepare yourself for a ‘sterling’ decline

 Currency  Comments Off on Prepare yourself for a ‘sterling’ decline
Feb 142013
 

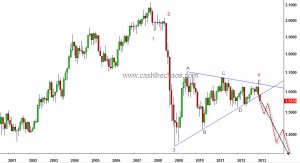
Cable (GBP/USD) has been moving in a triangle pattern since 2009 and yesterday's sharp and convincing dip below 1.5630 marked the end of this triangle formation.

Pound sterling breaks out of a 4 year triangle

Cable's monthly chart (above) with its Elliott Wave count shows that the currency is embarking on its 5th wave of decline. The target for this breakout is mammoth - Over the next 12-24 months we are very likely to see a level of 1.345 at the very least but will not be surprised if we see a level of 1.165.

When such a large text book pattern comes to fruition, clearly there will be some economic/fundamental tail wind supporting it. We are not going to bother ourselves with those and will leave it to the economists to decode that for us. However, we need to be aware  that such a large movement in a major currency is unlikely to occur in isolation. The Dollar will very likely strengthen against other major currencies. This is terrific news for Dollar Index bulls and bad news for many risk assets including precious metals and equities that rely on weak dollar forever.

Disclosure: I'm short sterling since January 2013 from 1.6113.

Oct 222012
 

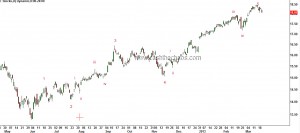
Apple dropped below 623.55 on Friday and that marked a 5 wave decline on a small degree. We know that when a market declines in 5 waves it normally happens to be a  part of a bigger move.

AAPL - 60mins chart, Data and Chart Courtesy Bloomberg

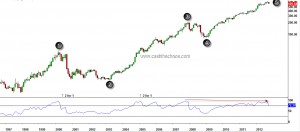
With that in mind, let us look at the bigger picture - the real big picture. As shown in the monthly charts below, it is possible to count 5 waves from the 1997 low. And at the top of wave 5 a clear drop in momentum readings - a disagreement between price and momentum.

Apple Monthly Charts; Data & Charts esignal

Wave 3 on the monthly charts saw a 6 fold increase and wave 5 was little over 3 times wave 1 through 3. The real kicker though is not the price relationship but the time relationship. Wave 3 was 2months longer than 1.618 times wave 1; Wave 4 and wave 2 have a perfect 0.382 Fibonacci relationship; and wave 5 is 0.78 times wave 3!!!

Let us zoom in little more closer - the weekly charts. The 5th wave starting from the 2009 low can be interpreted in a couple of ways.

AAPL weekly charts; Data and Charts - esignal

My interpretation is that the first wave within the 5th was extended. In that case we have a perfect ending relationship - Waves 3+5 are 0.382 times extended wave 1. The momentum divergence here is more pronounced than on the monthly charts.  So there is a good chance that the top 705 was a wave 5 top.

Seeing the above evidence, I lean towards the possibility that AAPL has seen a MASSIVE TOP, a 5th of a 5th. If I'm right, we are possibly looking at AAPL declining to $80 in the next 3-4 years. Either AAPL will burn cash or competition will crush AAPL or some other form of roadblock could be the reason but we are not bothered about the reasons. Reasons will come later. Think such a decline is not possible?  Think Nortel, Juniper, Himachal Futuristic, Satyam to name a few.  Short term: Apple could bounce from sub 600 to 650-674, if it does, I think it will be a low risk selling opportunity.

The broader implication if this analysis is correct - the world is up for some nasty months.

Disclosure: I'm short Apple. I own a couple of Iphones and an Ipad and I will be Queuing up for Apple's mini Ipad.

Can the new QE have any different impact than what QE2 had?

 Uncategorized  Comments Off on Can the new QE have any different impact than what QE2 had?
Sep 172012
 

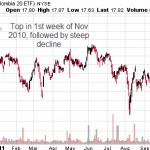
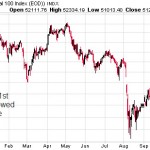
The sentiment in the investment world is on a sugar high over QE3. Retail traders are talking about sky high targets and broking houses are dishing out lofty year end targets. Now let us stop for a moment,  jog our memory as to what effect QE2 had on equity markets around the world. Date of QE2 announcement: 3rd Nov 2010. And here is what happened in Nov 2010...

Nifty in Nov 2010

Hang Seng in Nov 2010

Singapore STI in Nov 2010

It wasn't just Asian markets. The picture across the CIVETS markets was pretty similar.

Colombia

This is not a complete list of  equity indices that topped in Nov 2010 but I guess this is enough to drive the message.

Given that the new QE is not much different from earlier QE2 except for some small bells and whistles,  should one expect a much different outcome now and turn bullish on the markets for the long term? What was that Einstein quote about insanity?

I'll be watching the charts for reversal signals and be ready for a big punt if one comes through.

 Posted by at 8:51 pm
Apr 092012
 

Nifty(5322): Nifty's struggle and inability to cross 5385-5400 resistance is the first sign of trouble. If Nifty closes below 5260 that will be sign of more trouble brewing. Going forward, the most important data points for us are going to come from currency charts. If INR prints 52.2, it will be the ultimate confirmation for us that the rally from Dec 2011 is over and the path to a new low below 4530 is underway.

The Euro seems to be forming a head and shoulder consolidation pattern. A break below 1.30-1.2975 would be additional bearish clue for us.

 Posted by at 8:24 am
Mar 302012
 

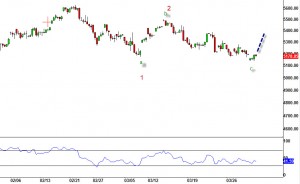
Nifty(5178): Nifty on expected lines went below the low of 5165. The bullish interpretation at this point is that the move from 5630 is a corrective decline and the correction got over at 5135. What is in favour of this? The intraday momentum has not been able to clock new lows when price has done so. However, on the higher time frame , daily charts, momentum is with price.

What's the bearish case - the market is in its third wave and the waves are sub-dividing in a 1, 2, 1, 2 fashion. INR is in favour of this scenario. Other currency cross-rates are favouring this outcome. China as pointed is bound for a big big low.

So we need to see Nifty stay below 5400 on the counter trend bounce. Quite possible it might not even cross 5320-5340. Today, being the end of a quarter - we might see some window dressing by FM's

The chart below shows the above scenario.

Nifty intra day chart

 Posted by at 8:59 am
Mar 162012
 

Nifty(5380): Nifty caved in sharply yesterday and shed 1.53%, off the lows of the day. From now on the speed of the move is going to be important be it higher or lower. If we see gaps or wide ranged bars for more than just a day, it will signal to us that the market is moving in a impulsive fashion. As projected in our intraday wave count a couple days back, we think we may have finished the corrective phase to the decline from 5630 to 5165 and the next phase that takes Nifty below 5165 may have started. Watch 5330 today if market blows through that, we can be confident of a new swing low below 5165 (ideally 5077).

Some people are seeing a Inverse head and shoulder on Nifty. Mind you inverse head and shoulder is a bottom reversal pattern. It must occur after a prolonged decline. What we have on Nifty is some sort of prolonged advance. Hence in my opinion there isnt one on hand.

Open positions: Nifty March 5k Puts @13, RIL March 780 Put @7.5; Long USDINR @49.8 SL 48.8 tgt 51.75 (partially booked at 50.75)

 Posted by at 6:38 am
Mar 122012
 

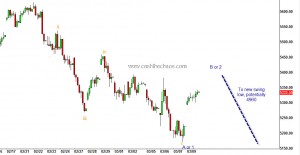
Nifty (5333.55): Ok, let the chart speak.

Nifty- Hourly charts

Look for resistance to kick in at 5403 or 5460. A very remote chance of 5520. To get here Nifty could take today's entire session and possibly a little of tomorrow's session too. But once resistance is in, a fast decline should start, be it a C wave or wave 3 -  both have similar characteristics. Remember, it will not be a straight decline though as shown by the dotted line but rallies will be small.

 Posted by at 8:31 am