Sep 242010
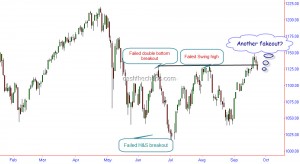
Yesterday's drop in the S&P 500 below the breakout level of 1129 is once again looking like a failed breakout. As highlighted in my September 2nd post there have been 3 fake out's since June already.
And each of these fake out's have resulted in a 6-8% move in the opposite direction. As highlighted in the inverse head and shoulder post, the volumes were already looking suspect and this drop back into previous range will give some powder for the bears. Near term supports at 1105 and 1090 must hold else the risk of yet another swing to 1040/1010 are on the cards.

Sorry, the comment form is closed at this time.