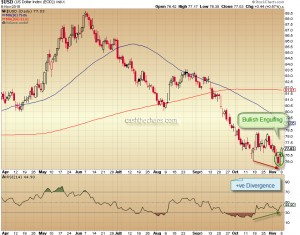
The daily charts of Dollar Index shown above, the drop from October lows to November lows is not matched by a momentum drop. This kind of positive divergence is usually a precursor to a trend change.
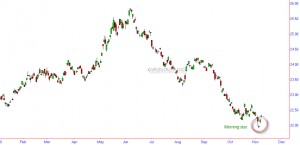
The UUP charts shown above, a morning star candlestick pattern is visible. When this pattern occurs it is usually a strong reversal sign.
Also, I can count 5 wave decline to the November lows and Sentiment readings from Trade-Futures are pointing to a very extreme level of bearishness for the dollar index (hence bullish from a contrarian perspective).
So what does all this mean for the other markets? Commodities and stocks closely tied to commodities are very likely to be the immediate victims. The daily correlation for equity markets with the Dollar Index, though varies now and then, currently stands at a range of -ve 0.83(for S&P)to -ve 0.94(for NSE Nifty) i.e. a very high inverse correlation. It is pertinent to note here that such a high inverse correlation existed for equity markets in November 2009 and when the Dollar Index started a powerful rally in December, a correction in equity markets commenced not until January. So a correction or a trend change in equity markets may either be immediate or may start with a slight lag depending on the strength of the anticipated USD rally. Stay cautious and watch how the markets pan out over the next few days.


Sorry, the comment form is closed at this time.