Sep 272010
 

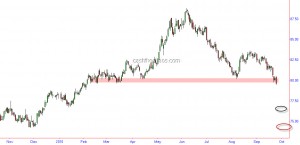
Last week, the Dollar Index breached an important support, the 80-79.5 region (highlighted), negating one possible wave count for a stronger and higher USD.

Dollar Index Daily Chart

The markets seem to suggest that Ben Bernanke was not just merely using empty rhetoric when he said deflation will not be allowed to occur. The reserve currency is getting debased. We already saw some intervention on the Yen from BOJ and we should expect more such actions from other monetary authorities around the world. One can also see Gold hitting new highs across almost all the currencies indicating potential or real drop in their values.

While in the past the US Fed has managed to prop the markets up by such debasement, my sense  this time around is that it will work initially before stocks and the US Dollar sink in lock-step.  As can be seen from the above charts, the Dollar Index gets support around 76.5- 74.2 and the all-time low of 71. I will be surprised if the world does not slip into a currency crisis below 71 Dollar Index. Until that happens, enjoy and embrace the ride in the stock markets around the world while being prepared for the future.
USDINR reclaims 200 DMA

 Uncategorized  Comments Off on USDINR reclaims 200 DMA
Jun 252010
 

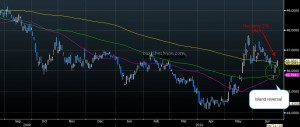
After a bout of choppy trading in the last 2 weeks, the USDINR pair closed above its 200 DMA.  The point to take note here is that the pair crossed  this level after registering a island reversal and is a pointer to further strength for the dollar against the rupee in the coming days.

USDINR Daily Chart - Source Bloomberg

A potential trend reversal for the INR

 Uncategorized  Comments Off on A potential trend reversal for the INR
May 192010
 

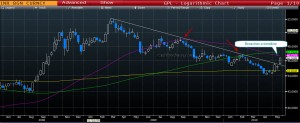
Today's price action in the Indian currency has put a question mark on the bullish price objective of 41.5-42.0 that we have been maintaining since last year. In today's trading, the USDINR closed above an intermediate term trend-line (see chart) that had kept the rupee's strength going.

Rupee weekly chart - Source Bloomberg

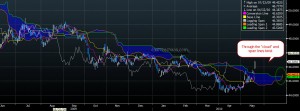
Looking at the Ichimoku charts,  the currency has overcome the "cloud" resistance on its daily charts. Also, a span twist is visible (green circle) which is another bullish sign for the USDINR (bearish for the rupee). All these price actions have transpired on the day when the Indian Nifty has closed below its 200 DMA for the first time since April 2009  - a sign that FII's may be heading for the door. Considering the above technical evidence, we expect Rupee to test the support of 47.6-47.8  in the short to medium term.

INR Daily Chart - Source Bloomberg

The longer term Elliot Wave count for the INR seems to suggest that what we saw from 52.18-44.05 may have been just a wave 4 and the current move could be the start of a wave 5 that could go on to test the level of 52. Although this is too early, we will keep this at the back of our minds.

Is INR poised for a brisk move?

 Uncategorized  Comments Off on Is INR poised for a brisk move?
Apr 122010
 

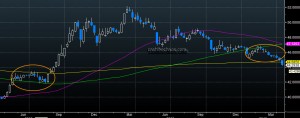
As can be seen from the weekly chart of INR, the currency has closed under the 200 period moving average after a period of consolidation. In Aug 2008, when INR went through a similar consolidation and closed above the 200 MA level, we saw a brisk 10% move (weakening of INR) in the next 2 months. Today, the picture is almost like an inverse mirror image (see circled region). Will the Rupee see a brisk move this time in the other direction (strengthening)?

Data and Chart courtesy: Bloomberg.