Inter-market analysis provides an extra dimension to technical analysis - the peripheral vision and the backdrop in which we are operating. Here is one such inter-market factor. To me this is pretty much like looking at the charts of the Baltic Dry Index.
Over the last few weeks if you have been left wondering if the markets around the world have turned a corner, you might want to have look at the following pictures.

Vessels backlog 1

Vessels backlog - view from my Condo
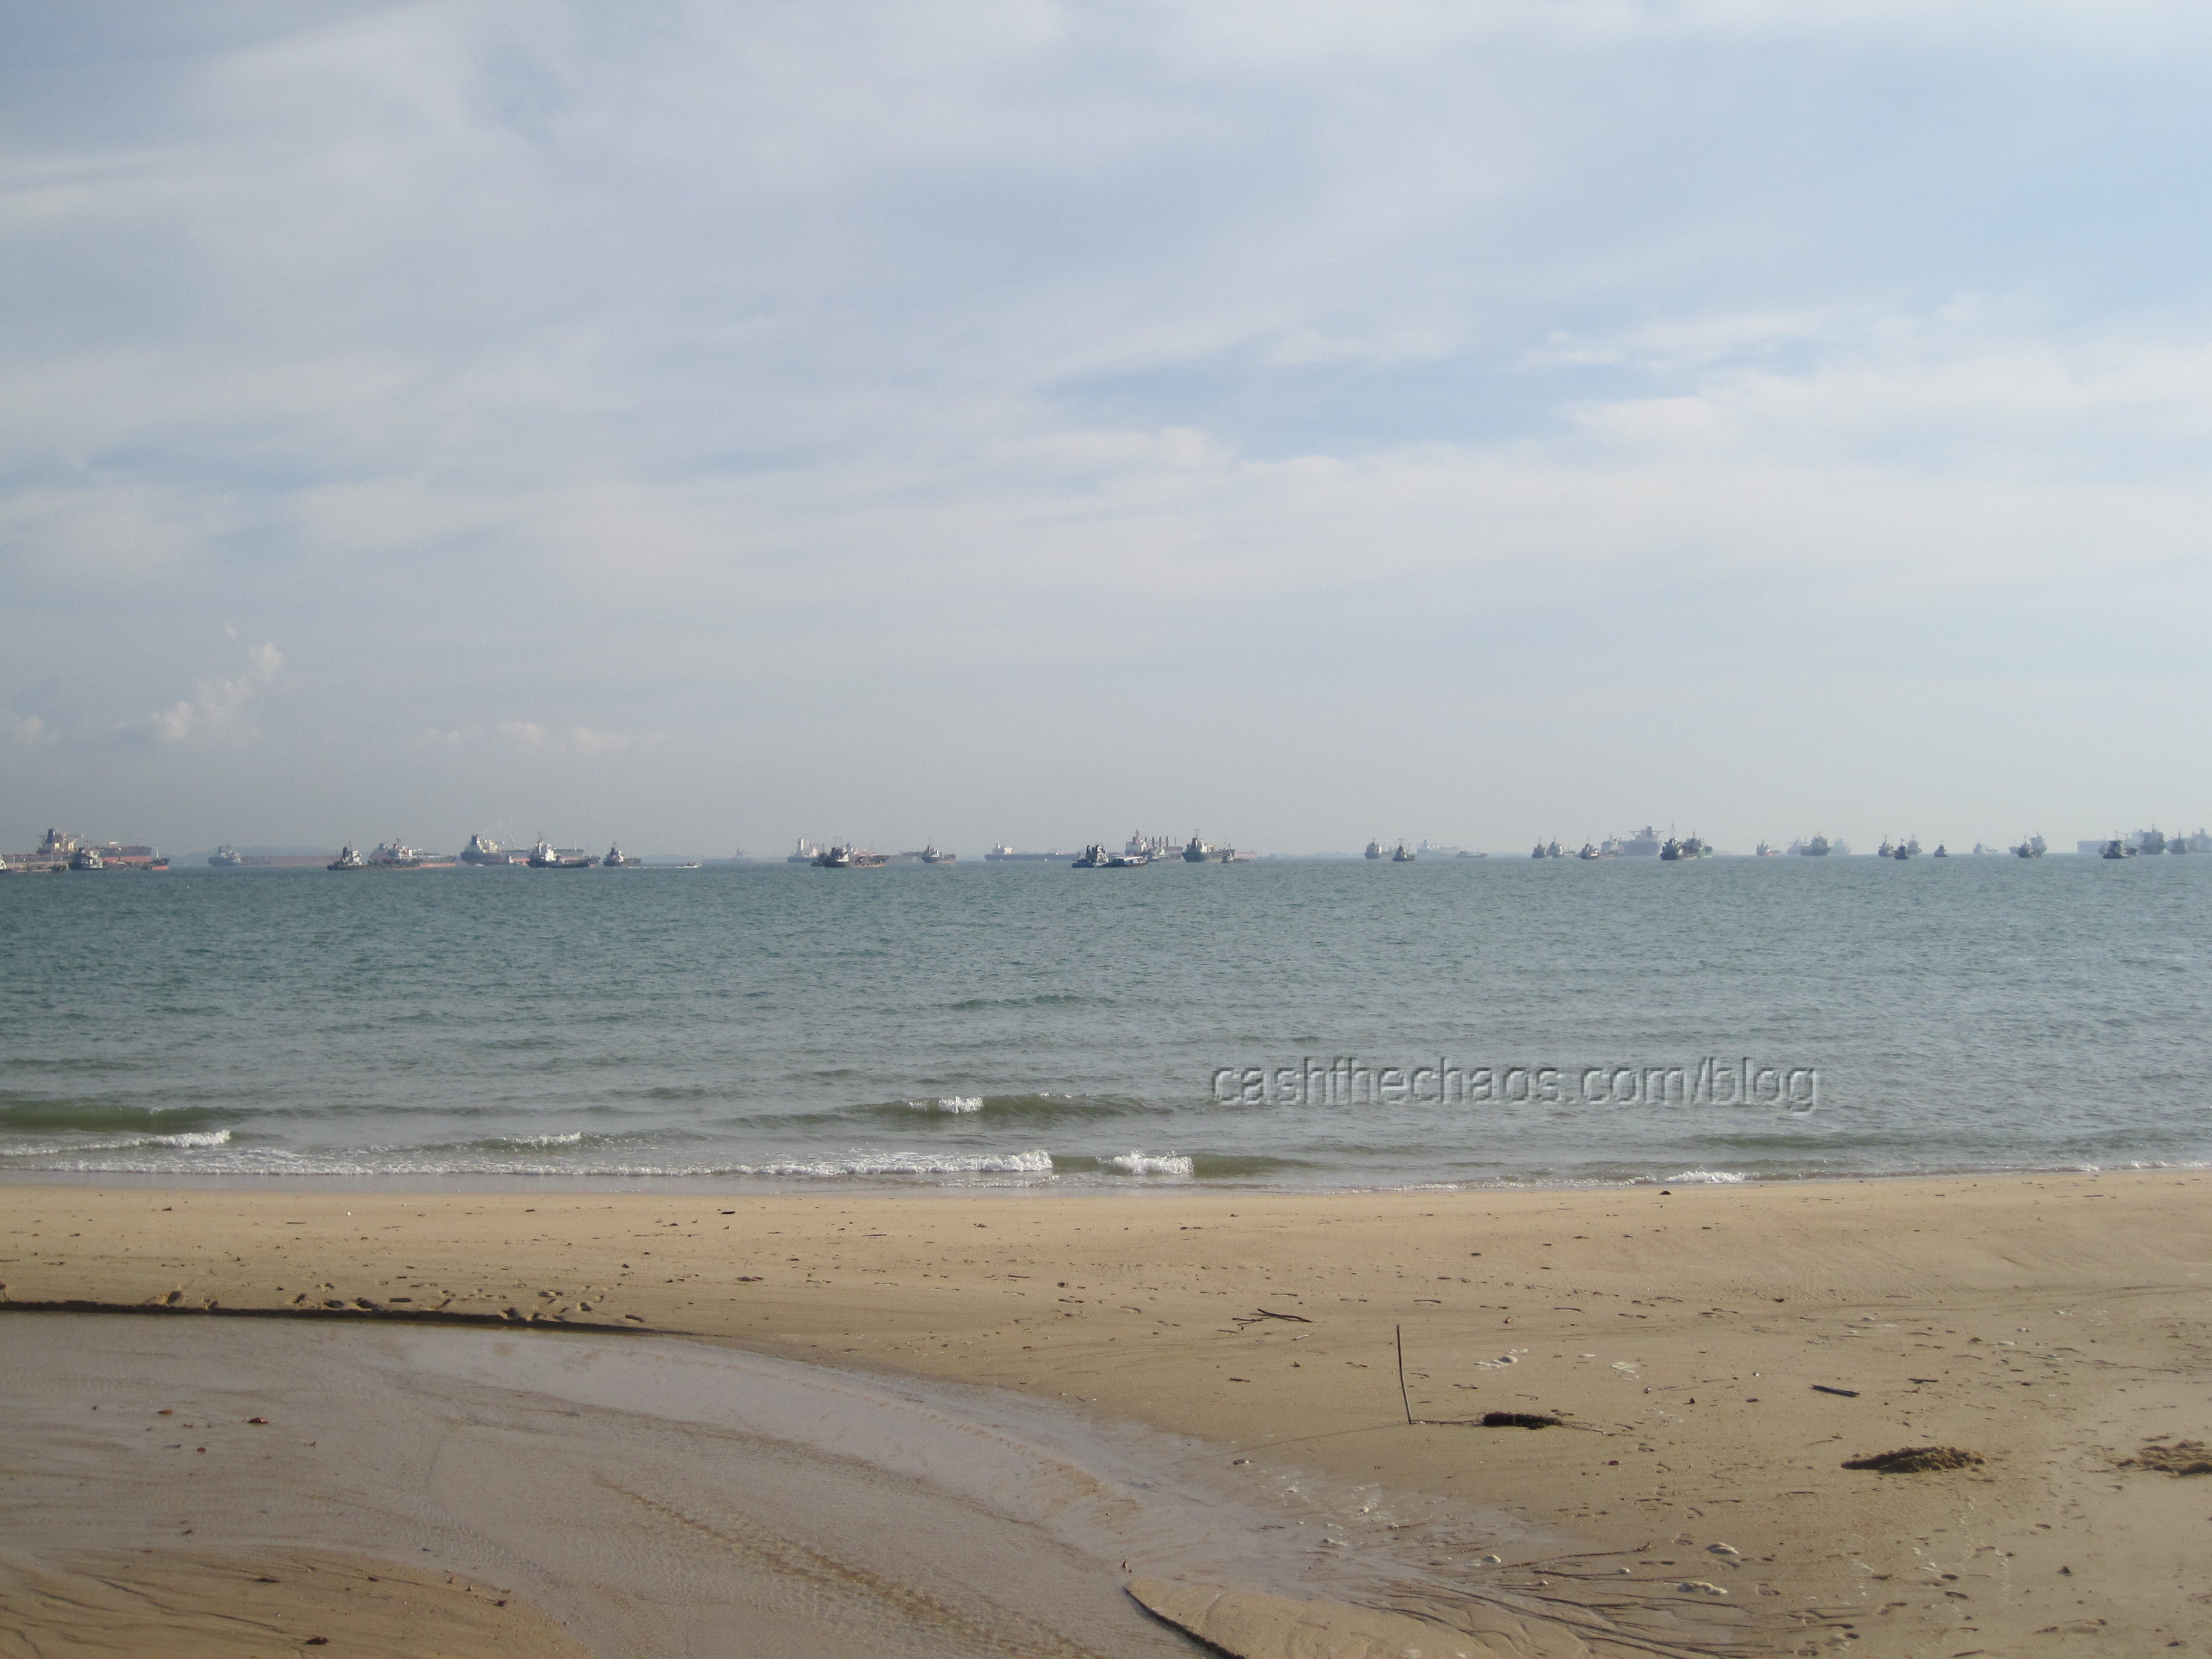
Cargo backlog 2
Please click on these pictures and have a larger view. As you might understand from the caption, these are cargo vessels that have been standing idle for months together here in Singapore and some might be more than a year. The number of vessels over the last few months have only increased albeit at an alarming pace. Talk to anyone in the shipping business they would tell you what these pictures are telling. I personally know someone who owned a ship and went bankrupt - their next generation is still trying to pay off the debts and in all likely-hood, that person is unlikely to pay off the debt until their retirement age. The same would be true of corporations. In short, this is not a cheerful sign.
Singapore backlog - a small video clipping of the ECP coast (singapore).
18 Responses to “A view of the global economy”
Sorry, the comment form is closed at this time.
Hi,
Looking at the charts of Baltic Dry Index also does not give too much confidence actually… I am not an expert on technical analysis, but Baltic Dry seems to be ready to dive.
Hi Jai,
It is high time we need a post from you on nifty.
Ajay
Hi Jai,
Spot on on TCS……good call…….the stock being 7% down says it all….guess for it to further go down, Nifty needs to come down…….
I would also request post on Nifty, (if you may) for us non-subscribers 🙂
Thanks……
Hi jai,
is it possible to send trading calls thru sms, as it is not possible for me to remain online, by the time i see the mail, there is a lag of one to two hours, one more request can u send the subscription receipt, as i can claim it as expenses,
regards
shabbir
Hi Shabbir,
I did send the sms thro my gateway software but the DND is blocking it and Im getting failure. Alternate methods and suggestions most welcome from all of you guys.
Best regards,
Jai
How about Whatsapp or BBM?
Hi Jai ,
I am not able to read your comments on ‘ India pre market Oct 17th’ topic and few other posts. Is it restricted and only available to folks subscribing to the premium content ?
Regards,
Nithin
Hi Nithin,
That is right, those are premium content.
Thanks for the quick response Jai.
Dear Jai,
Need a quick comment on nifty where it is headed. I am holding short positions. shall i continue to be short on nifty.
Ajay
Ajay,
Any trade, you must first understand where your view would be wrong. And then only enter a trade. If you know that and still are asking this question, then you have probably leveraged beyond your capacity. Normally, one should use the recent extreme as a stop.
Hope that helps.
Best regards,
Jai
Like you I was also very negative about the markets. As a rule I dont trade when the market is against me which it is for the last 15+ trading days. Miss your opinion on the market as you have gone paid at around the same time. I trade Intra Day/Very short term trader ( max 4-5 days ) . How/when/what should have told me about the reversal ? I still think the lows are waiting for us. ( Please tell us if you dont think so) What event will tell us of the resumption of the lower swing ? Also How much higher can it go ?
Just a bit of patience is required. This is similar to the Apr-May 2011 period. Bulls have made inroads but they may not have conquered.
I hope there is a post from you in the free/open to all section 🙂 as there has been a substantial move in nifty post your last open to all opinion. Waiting for your words of wisdom 🙂
Hi Jai,
i saw your comments on CNBC a couple of days back. You mentioned the range of 5175 to 5200 as resistance zone. I believe that was because that range was the End of wave 1 and since we are in wave 4 as of now, you were expecting the 2 waves not to overlap. Does the current wave structure qualify as a terminal impulse starting from JAN 2011, ( Part of Larger wave C of Flat) with one last 5 th Leg in the offing..? can u please share your thoughts..
Perfect Mr Kulkarni. That is the bullish interpretation, and fits well with 4th wave alternation tendency of EW. In that case, the market should not exceed 5490’s (which is what I had mentioned this morning) and hence a 5th wave drop should come through post that.
But be aware, the decline from Nov 10 high can be seen as a leading diagonal.
Best regards,
Jai
Thanks Jai, Lets hope that diagonal starting from Nov 2010, plays out till Feb 2012, meaning that wave A and wave C would have equality in time.
i just hope that Wave C = 50 % or 61.8 % of wave A.. . A fall in price beyond that would be too painful..
Many thanks for your help.
Best regards,
S V Kulkarni.
in my earlier comment, Wave C = 50 % or 61.8 % of wave A… i meant in Price terms. Time-wise, hopefully wave A and C would be equal.
Thanks again for your help,
Regards,
S V Kulkarni