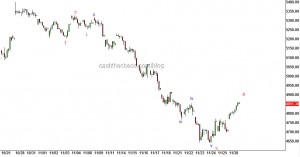
Nifty(4851): Finally, the long awaited relief rally kicked in and the markets are relieving the oversold levels. I do not think market should have any problem going above last weeks high of 4873 but if it doesn't its bearish and the powerful wave down is still incomplete. The ideal levels for this relief rally to roll-over to the downside are at 4901- 37 and 4983.
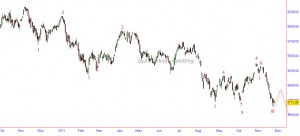
As per my time series analysis, December 8th(+ or - 1 day) points to an important high or low. I'm going with the probability of this being a low for two reasons (a) As can be seen from the chart above red wave 5 is still pending ; (b) Seasonally, December is one of the best months for India and India has not had a negative December for the last 9yrs. Hence, if we have a low on December 8th, markets could still be seasonally bullish and have another relief rally.
Ok now to yesterday's post - On yesterday's post - I had intentionally left an error, hoping one of you, particularly the Elliott Wave fans amongst would point to this error. The correct chart is here:
Now you EW fans- can you guys tell me what was the intentional error that was planted on yesterday's chart? I was just checking if you guys were paying attention to these notes 🙂
Open positions:
Silver: Short @$34.2 with revised stop at $33.5, partially booked @$31.4
Apollo Tyres: Long @64 stop 59, Target 71
Hero Motors: Short @2025 stop 2130 Target 1900 (greater bearish potential beyond 1900)
PS: I'll be on CNBC this morning. Will talk about Apollo and Hero if they ask about specific recommendations.
7 Responses to “Technicals Nov 29th 2011”
Sorry, the comment form is closed at this time.


hi jai ,
r u revising the stop lose of HH ?
one more thing i haven’t received any call on sms by the time i joined ur services.
is my number is not updated on your system ?
Regards,
shailendra
Hi Shailendra,
No new calls after Heromotors. You are on the list.
Best,
Jai
Link to Today’s CNBC interview please. Thanks.
Dear Jai
We can see a head and shoulder pattern developing in Hindustan Unilever on the daily charts..While the lower low has been formed, still waiting for the lower high.. Would appreciate your view as i am yet a novice when it comes to reading chart patterns.
Regds
Prateek Sinha
That is correct Prateek. It should not cross 403 now. Ideally one more up day would put a nice look to it. When it breaks 373 the volumes should expand considerably.
Jai
can we look at buying a call and a put of the same strike price and play it out till December 10tH
Jai Bala’s today Interviews
http://www.moneycontrol.com/video/technicals/ceiling-for-ongoing-counter-trend-rally-at-4980-jai-bala_625945.html
http://www.moneycontrol.com/video/stocks-views/apollo-tyres-can-test-rs-75-jai-bala_625965.html