Nov 152011
 

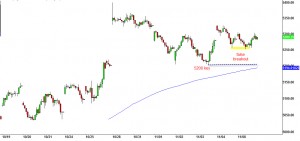
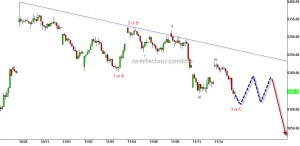
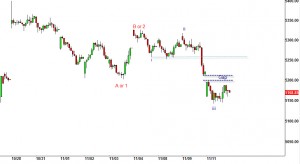
Nity(5148.35): A gap up open turned out to be an opportunity to sell as the markets at close managed to breach even the Friday's low by a slight margin.

Nifty intraday charts

The intraday pattern as at a stage where it is going to clue us in on the larger move for the next several weeks. In the chart above we are in the blue v wave. This v could end today closer to 5116, give or take a few points. If it does break, the next logical ending point for this wave is around 5045. However, what the markets does post the blue v is going to be more important. If Nifty follows the path shown from 5115 on the Nifty (blue dashed line), ie stays under 5205, the higher degree 5th wave should take Nifty closer to 5025 (red arrow). However if Nifty exceeds 5205, it is going to be a different play (we will come to that in the next post). So, if you are short, you might want to book profits around 5115 and reload closer to 5200 with a stop at 5206 cash or just hold with a stop at 5206 cash. However, if 5116 does not hold today, we have to assume that blue v will end at 5045 (need not be today).

Watch the INR - that is going to be key. Further weakness is not going to help stocks. If you have noticed, one thing that has been consistent over this results season - "Forex Losses"
 Posted by at 2:55 am
Nov 142011
 

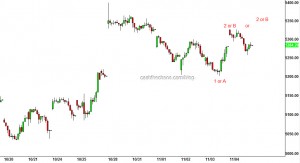
Nifty(5168.85): The shortened week for Indian markets brought the second successive week of negative close for the Nifty. A small gap was registered in last week's price action and an ability to fill this zone of 5200-5211 today will mean a strong downtrend is in place.

Nifty intraday charts

Considering the weekend movements in western bourses this seems less likely. If our labeling of the short-term moves are correct, Nifty cannot exceed 5256. (Nifty is unlikely to overlap into the teal dotted line shown on chart which passes at 5256 as this would violate Elliott wave rules). Also, the 61.8%  Fibonacci retracement level of blue iii (5317 to 5142) falls at 5250. Hence if we see Nifty hover slightly below 5250, it will be a  very low risk selling opportunity. Hence sell with a 5 point stop above 5256 cash nifty level. However, if Nifty pauses much lower, we have to evaluate the intraday movements and then act. If this push stretches all the way to 5250, the minimum drop in blue wave v will definitely be 5179 if not 5138 or 5065.

Petronet:

Petronet - Daily Charts

 Posted by at 2:36 am
Nov 112011
 

Nifty(5221.05): The single most important thing we are going to watch today is if Reliance can close below 855. If it does, the chances of Reliance dropping to 760's if not a new low under 700 would gain strong currency. It was already pointed out a couple of days back how Nifty seems to have moved with Reliance in a lock-step fashion. So that would in effect negate the bullish prospects and cement the bearish case.

Nifty intraday

On Nifty, even an intraday touch of 5035 will eliminate the bullish case. If  Reliance does close below that 855 level this is probably going to be a matter of time. Watch for supports today at 5140-65. If we see a gap down nearer to this level be careful opening fresh shorts here.

As was pointed out in the technicals big picture, the INR was never in a favourable position for the bullish case. The Indian currency is very close to the 52 week low it made in October. A new low here would also add weight to the bearish case.

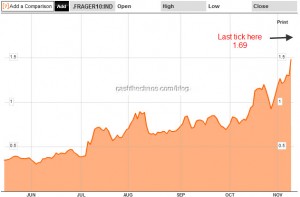
Meanwhile in Europe - remember we had pointed to the 2 decades wide spread for the French-German 1o year bonds? And said market was expecting an event? Now, S&P has eliminated the downgrade of France temporarily. BUT The spreads are now even wider after S&P reiterated the AAA on France. So wait for some other event.

French-German Spreads

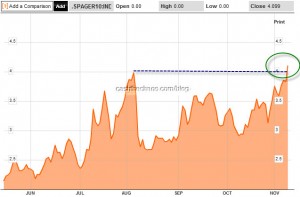
And watch out for headlines : Spain will soon be hitting the wires. Although the debt here is not as bad as Italy, borrowing costs are going to make things bad for Spain.

Spanish-German Spreads breakout

 Posted by at 3:04 am
Nov 092011
 

Yes, Berlusconi will go and with him the 1.9 trillion euros of oustanding debts too will go away and lenders are going to fall over each other to lend money for free to Italy. Ok, lets get back to reality.

Nifty (5289.35): Markets opened higher only to come down lower, make a small false break below friday's low and then head back higher.  These small false breakouts are small clues that market leaves us, typical of B waves, that market is itching to go down.

Nifty intraday charts

So, potentially we have one more leg up in the short-term that is likely to end around 5334-5356 (we noted this as the ideal level since  Friday). Watch out India Vix has dropped from 39 to 23, nearing the levels it was before the August decline. A little more of complacency is likely to push markets to danger zone.

If markets do exceed 5356, watch out for the 200 DMA at 5395 (and falling). State bank the biggie reports today. May be this could hold some surprise, positive or negative.  The technical structure for SBI says its undergoing correction but we are unable to take a stand here, the possibility of a strong drop to 1800 or a mild 3-4% upmove are 50-50, so we are not able get much clues through this stock.

Keep side-counters like Voltas, Petronet on screen we will try to do a small futures trade here under ideal conditions.

 Posted by at 2:51 am
Nov 082011
 

Just look at the chart below - if you were wondering why did Nifty open lower when SGX Nifty was up or why did Nifty suddenly spike up from the low of the day - here is one snapshot that tells you everything. The time stamp at the bottom are London time. If you place these charts side by side for anyday in the last few weeks, it has a striking similarity.

EUR and Nifty

All interference work temporarily. Resources are finite. Once resources and words are exhausted, the underlying trend takes over.. with even more vigour.

 Posted by at 10:09 am
Nov 082011
 

Nifty(5284.20): On friday, we saw some supply around 5325, which was one of the projected resistance. As can be seen from the chart below either this has completed the pullback we were looking for or there is one last push that takes Nifty to somewhere between 5334-5356.

Nifty intraday chart

A drop below Friday's low would be an opportunity to short but this is a very aggressive trade.Do not risk more than 35 points on Nifty. (If this happens in the first 5mins avoid). The important short-term supports are at 5190 and 5165

We saw some weakness come through for Reliance on Friday. Weakness here is going to be very critical for the bearish case. If we project the first leg of the decline of Nifty from the November highs to November lows to the January high's the low of 4720 on Nifty is just a few points over 225%. At the August low, it is exactly the same for Reliance, just a few points over 225% projection. Though, ONGC and BHEL were the first to top out in October,  it was felt that banks were the main drags since last year, Nifty seems to have moved in lock-step with Reliance!! A sustained move below 872, the low of Friday would help the bearish case and a close below 855 would probably seal the bearish case.

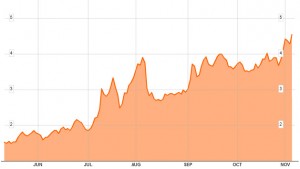
In the global markets, there is a broad divergence between the bond markets and the equity markets. When they diverge, trust the bond markets. You see the headlines are moving from Greece to Italy. Next it would be Spain and later on France. Remember, the bond yield spreads for France are the same level it was just before Britain went crashing out of the ERM in 1992.

Italian-German Bond yield spreads at a EURO ERA HIGH

Also, over the last few weeks Silver has been under-performing Gold by a margin. When speculative energy or the risk taking appetite is back, you will see Silver out-perform Gold. So there are enough warning signs out there. Stay safe.

 Posted by at 2:42 am
Nov 042011
 

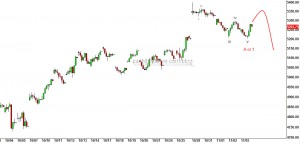
Nifty(5265.75): Nifty defended the 5200 level and bounced off the lows of the day. The key takeaway from yesterday's price action was that the decline has been in a five legged fashion.

Nifty - Hourly Charts

When a market declines in five legs (see chart above), it is normally part of a larger decline. The ideal levels to watch for a turn after this short term push would be around 5324 and 5350. Volumetric analysis also tells us that 5320 and 5340 could offer fair amount of resistance. The 5350 level seems more ideal to me. The ratios drawn from this level coincide well with important supports of 5160 and 5030 (that way the markets could posture an image of support being held when it drops).

The anniversary of last year's peak falls on Saturday, the odds of market running into some serious resistance today or on Monday is a good possibility. (Just one example if you are curious why this is important: the Satyam scandal hit the markets in 2009, exactly on the anniversary of 2008 peak).  May be the G20 meet and the ECB rate cuts could provide the short-term euphoria. Stay nimble.

 Posted by at 2:54 am
Nov 022011
 

Nifty(5257.95): Nifty has so far partially filled the gap that was above 5169 and from the early morning SGX Nifty quote does look like there is going to be a further push down. Next significant supports for the short-term supports are at 5190-95 and 5150-40. IF there is a gap down beyond 1% on the Nifty it would be prudent not to short. The best place to buy or sell is always at the first reaction to a move. We have seen Nifty drop from 5400 to low 5200's, now we will wait for the reaction come and through and see to it that the dip buyers have spent their energy.

The most important take away from yesterday's move was from Reliance.

Reliance - Daily Charts

It was indicated in yesterday's note that Reliance was showing early signs of weakness and here is the confirmation from Mr Market. If the rise from August low was the start of a fresh uptrend Reliance should not have overlapped into 858 but it did and hence the rise is corrective. If your know a bit of Elliot wave you know why but what is important is the implication. Also, notice the October low for Reliance was way above the August low and this strength was the reason why we did not see a breach of 4720 on Nifty. I expect Reliance to trade around 842-848 at open and provide a relief rally. It is this rally we would interested in selling into. Like Reliance's overlap we should also see Nifty overlap into 5215 to eliminate the bullish case (though 5170 would more ideal). Be patient and let the opportunity fall on our lap.

 Posted by at 2:17 am
Nov 012011
 

It's been a while since our last post on precious metals. The price action right now seems to be offering a decent opportunity for a trade here.

Silver:

Silver Futures - Daily Charts

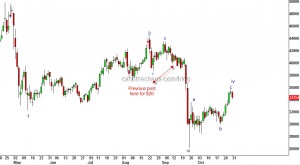
The last post on silver was on Sept 16th when Silver was around $40 and expected a decline to $26. We are labelling that as part of the third wave and the move off that low has been a struggle and it seems like a corrective pattern and hence labelling as corrective 4. If this is correct, Silver should see a drop to atleast 28.8, if not a new low to 24.5. So a high above the 28th October high would negate this view and should be used as a stop.

Gold:

The technical position for Gold is slightly different but direction is the same.

Gold Futures - Daily Charts

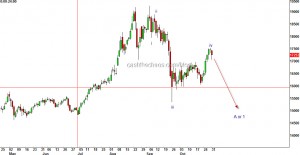
A move above the Oct 28th high would negate the bearish view but Gold is expected to trend lower to 1605 or 1513. A stop above 1755 is a must.

While I'm confident about these setup, the internal sub-divisions on these PM's is not ideal but I like the Dollar Index's internal sub-divisons. So I guess this should make for a neat trade.

 Posted by at 8:04 am

India pre-market November 1st

 Indian Market/Stocks, Premium Content  Comments Off on India pre-market November 1st
Nov 012011
 

Nifty(5326.6): The levels of 5220-5320 remain an untouched zone on the way down and as well as on the way up. Expect some gap-filling exercise over the next couple of sessions.

Nifty-Daily Charts

While this need not be a complete fill of the gap. The key for eliminating the the bullish case is an overlap into the former high of 5160 on the Nifty. The market's breadth so far has been bad, to say the least. While this may improve over the next few sessions, so far this is not a very encouraging case for the bulls.

The key as I said yesterday, is the European bond markets. The Italian spreads to German bunds have hit a new high yesterday. Higher than they were before the EFSF announcement. Now why is this important? The bond markets are telling us that the EFSF programme has done nothing to soften bond yields and when the Europeans go out to borrow next time, they are going to pay higher rates. And every country Ireland, Greece, Iceland before they went off the cliff, the bond yields started to widen in the same fashion.

The Euro also has delivered an important price action.

Euro Spot- Daily Charts

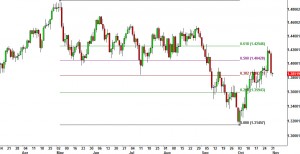
The single currency has started cave in sharply exactly off the 61.8% fibonacci retracement of the May-Oct decline. If the next push higher stops under the 61.8% level or if we see a straight drop below 1.3790 on euro spot, the christmas party for Europe has come 2 months ahead and there is going to be no party during christmas.

Reliance: Keep a watch on Reliance, if we see a negative close this week ending Friday, the possibility this is going to 700 would be a reasonable event.

 Posted by at 3:04 am