Reversal in Crude?

 Commodities  Comments Off on Reversal in Crude?
Apr 122011
 

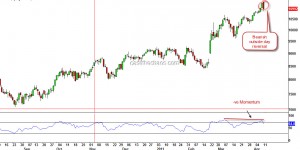
The daily charts of Nymex Crude registered a very important price action which could potentially mark a trend reversal. In technical parlance this is called a bearish outside day or a bearish engulfing candle.

Momentum readings have also diverged negatively with this occurrence and the number of contracts that accompanied this sell-off also ticked up (a nice to have). Now why should you pay attention to this? Besides the fact that the 2008 reversal was also a bearish outside day, I'm sure you would have heard and seen reports of $200+ crude over the last few weeks flying thick and fast. Essentially, it is a very crowded trade.

Now if crude does come down, do not be mislead into thinking that a falling crude may be the new impetus for stocks. If this is indeed a reversal for Crude, stocks are also likely to start a new downtrend or resume the previous down draft depending on which markets you are focussing on. Here is an interesting snippet regarding crude from one of my past interviews:

httpv://www.youtube.com/watch?v=hJuWU1GEYD0

As a reality check, let me also add that I do not see such a reversal in Brent Crude. It would have been another nice to have and would have added more weight to the reversal.

Mar 102011
 

Copper, which is often considered a proxy for the global growth, dropped through some important support levels.

Copper Futures - Daily Chart

The intermediate term trendline from June lows, which was holding up this market, gave way along with expanding volumes. The move from June lows to the November highs is a clear 5 wave pattern and the 5th wave is also related to the 1st wave by a Fibonacci ratio - a normal ending wave relationship. Also noticeable on the charts is the volume expansion as the red metal declined from its February highs.

The blue dotted line shown on the charts could be considered as a Head and Shoulders top and the breach of 424 price level would become the breach of the neckline that completes this pattern.

Considering all the above evidences, it does look like the metallic professor is saying the winds of change are here for the global economy. Expect the S&P 500 to drop below 1294 swing low in the immediate future which in turn is likely to result in a larger decline.

Mar 082011
 

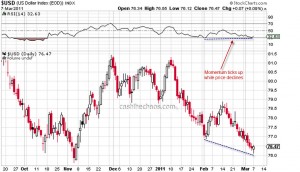
The Dollar index has been on a steady decline since mid-February and is currently one of the least loved asset.  While price has drifted lower, the momentum readings have not matched the price lows.

Dollar Index - Daily Charts

If we went back to the 7th Feb blog post on the Dollar Index (from where there was a small bounce), the Index is trading SLIGTHLY below that medium term trendline. All these line up well for a bear trap. If the currency basket closes above 77.25, I will be brave to venture a long here.

It is also time to have a look at the charts of crude given the amount coverage it has been getting over the last few weeks.

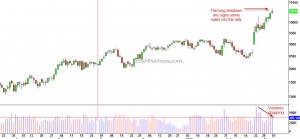
Crude - Daily Charts

While there are no visible signs of exhaustion or reversal here, there are some early warning signs. The volume for these contracts has been dropping over the last few days. If we have a higher close for one or two sessions and then a mild/sharp sell off day, one of my synthetic indicators is likely to flash a sell signal at least for the short-term. The most important signal, I see here is that there is hardly anyone who is NOT BULLISH or does not expect $150-$200 crude. In fact, one famous author of a commodities book, who had been bearish on many commodities including crude is expecting $200 crude now!!!!  Let me warn you here. I'm not trying to say it is time to short crude here. In fact,It is suicidal to out guess the market.  A good trade practice is to be prepared around important pressure points, wait for the reversal and if we have one, evaluate the risk-reward and then pull trigger.

 Posted by at 6:21 am

Raw Sugar – Topped out?

 Commodities  Comments Off on Raw Sugar – Topped out?
Feb 092011
 

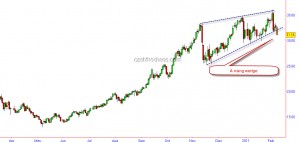
Raw Sugar had been on a tear and the run may have come an end. The chart below shows the commodity breaking out of a rising wedge.

Raw Sugar - Daily Charts

Wedges are ending patterns and have a fairly high degree of reliability. Also from May lows, I can count 5 waves to the February highs and Wave 5 is 1.6 times Wave 1 which is a Fibonacci relationship. If the commodity declines quickly over the next couple sessions, this would be a reiteration of this sell signal. Very interestingly, Raw Sugar has some seasonal cycle working for the last few years around February - top in 2010, 2008, 2006, 2003 secondary top in 2007, 2005 and bottom in 2004 and 2000.

Watch Copper

 Commodities  Comments Off on Watch Copper
Jan 062011
 

Copper:

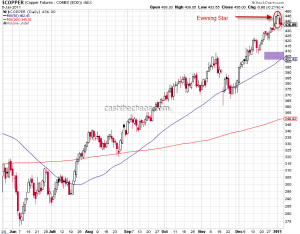
Copper - Daily Chart

An evening star pattern is visible on copper's daily chart. While this is a high probability reversal signal, a close into the coloured region would add further weight to this reversal signal.

USD:

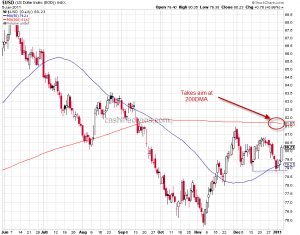
This currency basket clocked a wide ranged bar yesterday and is taking aim at the 200 DMA. With a micro double bottom in place, piercing through the much followed 200DMA is the likely scenario.

 Posted by at 3:39 am  Tagged with:

Topping signs in Precious metals, CRB Index, Crude

 Commodities  Comments Off on Topping signs in Precious metals, CRB Index, Crude
Dec 082010
 

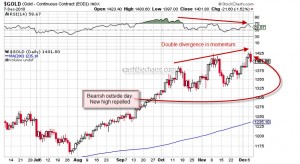
Gold - Daily Charts

As can be seen from the above charts, the climb up for gold has been loosing lustre, at least for the intermediate term. Each successive peak has been on declining momentum.

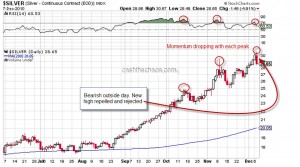
Silver - Daily Charts

As one should expect the picture is similar for silver, double negative divergence just as in Gold. Also both these precious metals made new intraday highs only to be repelled lower and rejected by the market - a bearish outside day formation.

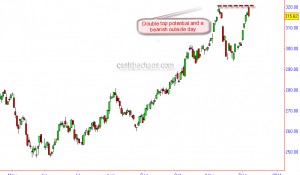
CRB Index - Double Top potential

The CRB index has also formed a bearish outside day right the previous swing high and thereby raising the possibility of a double top formation.

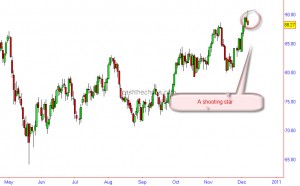
Crude Oil forms a shooting star

A shooting star pattern is visible on Nymex crude. The momentum here too has been diverging negatively with the price peaks.

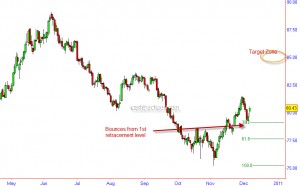
Dollar Index - Bounces from 38.2 Fib retracement

A look at the charts of the Dollar Index, shows that the Index has probably resumed its uptrend after a 3 day corrective decline. The index is bouncing from its first fibonacci retracement level. Over next 4-6 weeks a level of 85 is the price objective for this currency basket.

Barring an immediate reversal in the above markets( though not impossible), one should expect the negatives to start trickling into equity markets.

Red Alert: Five Charts and their implications

 Commodities, Indian Market/Stocks  Comments Off on Red Alert: Five Charts and their implications
Nov 292010
 

A couple of  weeks back I had posted a note on my own derived indicator and highlighted how important it was for the indicator to hold above the previous trough. On Friday, this indicator dipped below the previous trough on a closing basis and has warned that the Indian markets have probably peaked and a bearish phase is a very distinct possibility. So naturally one has to ask - how has this indicator fared in the past?
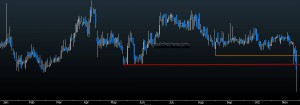
Indian economy barometer

This indicator has a commendable track record over the last 10-12 years:

1) In 1999 - the indicator peaked in Oct 1999, and warned of a bear market a few weeks before Sensex and Nifty peaked.

2) Likewise in 2003 when the Sensex/Nifty bottomed in April, this indicator was a few months ahead signalling an impending new bull market (some might consider Oct 01 as the bottom for the Indices, even then this indicator was ahead)

3) In 2006, during the infamous sharp drop in May this indicator stood its ground.

4) In Oct/Nov 2007, this indicator warned of an oncoming bear market.  The Indian markets peaked in Jan 2008.

It is often a good idea to look at other inter-related markets before coming to a conclusion about a major trend-shift. And here is where the fixed income /bonds come into the picture. Here is a chart of the 10 year OIS swaps.
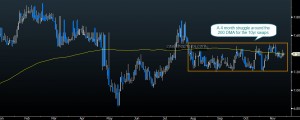
10 Year Swaps - Daily Charts

As is evident from the chart, there is still an intense struggle to cross the 200 DMA. AND when stock markets were trading near the all time high, the 10yr swaps were actually miles away from the peak made in February!  If stocks are that attractive why are investors still seeking the safety of fixed income?

I have for quite some time held that the continuation of this bull market is largely dependant on the debasement of the USD. Which was exactly why I had stressed the importance of staying  near the door of the bullish camp and having price objectives as opposed to a price target (see CNBC interview) on emerging markets, Gold, Silver and other asset classes. That brings us to the chart of the Dollar Index:
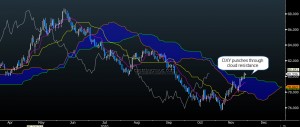
Dollar Index - Ichimoku charts

Not only has the Dollar Index reclaimed the key level of 80, it has also punched through the cloud resistance on its daily charts. If  my reading of the wave count here is correct, what we saw between QE2 day and Nov26th was just a milder part of the Dollar Index rally. The stronger portion of the rally has just about begun! ! (Remember the tight inverse correlation between emerging markets/commodities here and here?)

In 2010, emerging markets have had 2 significant corrections prior to November. One in Jan-Feb and the other one in Apr-May. The gross short interest in MSCI EM was 15% lower at November peak when compared with the January peak. That is a substantial level of complacency!!
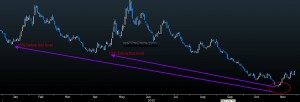
MSCI EM Gross short interest

Let us also look at Gold which can give us a fair idea of inflationary/deflationary pressures in the global economy.
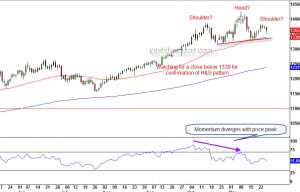
Gold Daily Charts - A potential H&S top?

The daily charts of Gold shows us that the swing to 1425 is in disagreement with the momentum readings. We can also see the potential for a Head and Shoulder top formation.  A close below the neckline, currently at 1340, is likely to augment further selling and a minimum drop to 1225 level is the expected outcome of such a breach.
Nov 142010
 

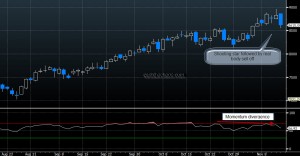
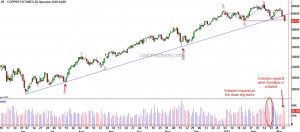
The reddish metal which usually acts as a leading indicator for the equity markets, threw in a late endorsement of the recent down move.

LME Copper - Daily Charts

The sell off on Friday reiterated the "shooting star" candlestick signal of the previous trading session. Already, the momentum peaks were not in agreement with the recent swing high. Expect a test of short term support at 8155(LME Copper).

 Posted by at 11:44 pm  Tagged with: