Jul 152010
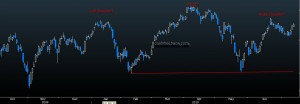
Here is a chart of Indian Nifty in Dollar adjusted value.
As is obvious from the above chart, Nifty has not even crossed the June highs, leave alone the April highs. And this could be the completion of a right shoulder in a head and shoulder top. While Nifty could very well continue to push higher and cross the highs of April in dollar terms- but other technical evidences at the moment do not favour that scenario. I guess by the time I post my next update from Singapore, markets should have more evidence of which way they are headed.
Good trading to all!
3 Responses to “Its not so peachy yet for Nifty”
Sorry, the comment form is closed at this time.

MAY MONTH ON MONTHLY CHARTS, CANDLES SHOWED BEARISH EVENING STAR PATTERN. WHICH IS TREND REVERSAL CANDLE
That is true Raghu but we are above that high in Local currency(INR). So that signal has been rendered void. We need to act on fresh signals.
sorry, jai pardon me
signal gets void only if we have close above on 5399 on monthly charts, that is this month .
there are supportive indicators which are having divergence.
9th july on daily charts we broke a small triangle which has target of 5527-5535.
on monthly charts we have spiningtop candle formed on 29-feb 2008 whose high was 5545. this can act as resistance.
there is a possibilty we can go touch these target in next 10 trading days and retrace back to close below 5399.
so this can be a potential false breakout .