Aug 302010
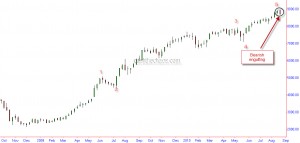
I did mention in my friday's update that a close below 5452 would be a bearish signal for the Indian market. Besides an engulfing bearish candle pattern on the Nifty, one other key index in this bull run, the auto index has also formed a bearish engulfing candle on its price chart.
In March 09 when the broad markets were trying to form a bottom, this sector was already on its first leg of the rally. As can be seen from the chart above, besides the candle pattern, the advance looks like a completed 5 wave advance indicating a possible exhaustion.
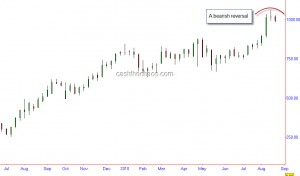
Looking at the chart of Tata Motors gives a similar picture. Further negatives likely for Tata Motors if the stock starts trading below the previous week's low of 983.


Sorry, the comment form is closed at this time.