[polldaddy poll=5480928]
The blame game begins 😀
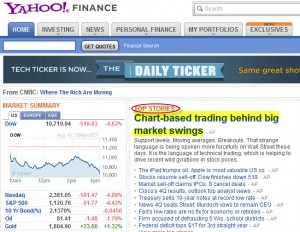
Did you ever doubt the movements in the stock markets over the last couple of weeks was not a bear market fluctuation? Here is proof that it is- the above headline captured from Yahoo/Reuters.
Wait a second. I thought fund managers never looked at charts. Wasn't it always their super intelligence and Ivy league education that drove their decision making process? You mean to say small guys who look at charts churned all those trillions of dollars of Market Cap across the globe and the fund managers just sat there and did nothing to prop up their NAV? No value buying? You mean to suggest that algorithmic trading do not take into account PE, Price to book and other parameters and just supports and resistance?
I've seen such Technical Analysis/ Chartist bashing in every bear market in the last 12 years. Having worked in an institutional broking arm in the past, I can tell you this - a technicians full worth is realised only in a bear market. The PE multiples, consensus forward earnings put forward by the leading broking arms are very rarely ever, leave alone being right, even close to being right. In a bullish environment these numbers give the illusion of being right. So when a bear market kicks in, the mirage disappears, everyone wants to speak to the chartist and understand where the markets are headed. Do you think I'm bashing fundamental analysis? Nope. Here is the proof.
Do you know what was the consensus earnings estimate in Jan-March 2008? It was close to 1000 for the sensex(check here and here). That number was revised down to 933 in Oct/Nov 2008 citing slowdown in economy (euphemism for I'm watching price action). Any guesses when that number was achieved? Now, HOLD YOUR BREATH! And take care of your Jaw! We are yet to see that on Sensex!!!!! I'm not talking about the 1000, I'm talking about the revised number of 933. The BSE website shows the current earnings for the Sensex as 913!!!! The current forward earnings estimate for Sensex is around 1200. So the next time you hear markets are cheap compared to their earnings - you might want to think or ask "based on what? Trailing or Forward earnings?"
For fundamental analysis to be effective one must have an approach like that of Warren Buffett or the Chandler brothers who stay far far away from the action, observe, analyse the markets and pick value like a hawk.
Now do not get me wrong, I know some brilliant fundamental analysts in the industry who do not come up with silly numbers like cited above. But those guys are a very rare breed.(Example: So rare that one Fund manager made the CEO of Tata Power wait so that he could talk to an analyst friend of mine)
httpv://www.youtube.com/watch?v=2Dj9v9s9buk&feature
Gold is not money!! And central banks hold gold because of tradition!! T R A D I T I O N!! 😀
I'm posting this update on Nifty from my holiday spot in Bangkok, so this will be short.
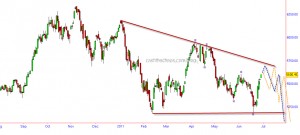
On the charts above, note those small violet squares (you may want to click on the chart for a zoom) that mark the swing highs and lows. This is how waves progress, each move moving beyond the extremes of the previous move and in a five step fashion. So, I'm treating the current move as a corrective move to the decline of 5944 to 5195 and not as a trend change. If you heard me on CNBC on 20th June, the day markets hit 5195, I had expected a reaction to 5485 but this one has been stronger than that. Nevertheless, it would have prepared you to go slow on the bearish side.
Going ahead, the rise from the June 20th low should remain "a three" for the bearish case. Hence, we should expect Nifty to start reacting lower from the red trendline marked on the chart (5720 and falling by 5 points each trading session) - which would raise the prospects of a descending triangle OR react lower from 5660's. Either case, I would NOT put my feet back on the bearish pedal atleast till I see a lower high registered. I have plotted a couple of possible routes on the chart.
Signing out, until my next update from Singapore - man, its really hot here!
Gold and Nifty
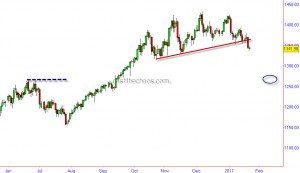
Gold broke through a short-term trendline and has opened up potential for downsides. (If you see our last few posts on Gold, we have been anticipating this decline.)
If you are a wave fan, you would note that this decline is coming after a 5 wave advance and this decline below 1352 marks the beginning of a strong decline. We are expecting the shiny metal to find initial support around the June highs of 1265.
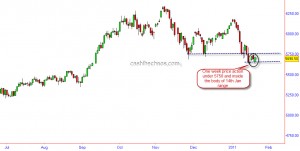
The Indian stock markets though had an advancing week, people have to pay attention to the range of last week.
The whole of last week markets meandered under the range of previous Friday's(the day it breached key support at 5690) range!!! If this is not bearish consolidation, what is??
There will be no updates till the 5th - unless there are some significant moves in the markets
Correction or trend reversal?
In June, I had posted a note on this indicator and wanted us all to keep an eye on it. However, the indicator averted a double top risk and stayed above the previous trough during the May-June correction. Once again its time to keep an eye here. If this indicator dips below the orange line, it would be first warning sign that the existing uptrend is starting to turn weak. Although the possibility of a trend reversal exits only below the red line. I will post an update on this indicator if the indicator dips below either of these two levels.
However, this time around there are couple of things that are loaded in favour of the bearish camp. One, Reliance is an under performer unlike the previous time. Two, SBI, a key leader in this rally, has also started to show pronounced weakness. Thirdly, there is a pronounced negative divergence on Nifty/Sensex daily charts.
What's favouring the bulls? The longer term momentum has matched with the price peaks and one possible wave count points to another leg up (need not result in a high though).
Trade set up on P…
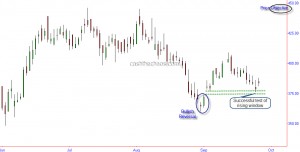
This engineering company has formed a constructive price pattern at its current level of Rs386. After a bullish price reversal at the september lows, this stock formed a rising window pattern. In yesterday's price action the stock successfully tested this support level and the stock got bid up. The larger price structure provides a price objective of Rs440-460 over the next 1-4 weeks. If your risk appetite is low, your stop loss should be below the rising window, else place a stop below Rs360.
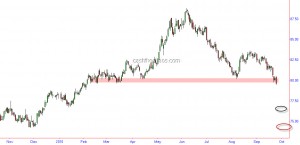
Last week, the Dollar Index breached an important support, the 80-79.5 region (highlighted), negating one possible wave count for a stronger and higher USD.
The markets seem to suggest that Ben Bernanke was not just merely using empty rhetoric when he said deflation will not be allowed to occur. The reserve currency is getting debased. We already saw some intervention on the Yen from BOJ and we should expect more such actions from other monetary authorities around the world. One can also see Gold hitting new highs across almost all the currencies indicating potential or real drop in their values.
While in the past the US Fed has managed to prop the markets up by such debasement, my sense this time around is that it will work initially before stocks and the US Dollar sink in lock-step. As can be seen from the above charts, the Dollar Index gets support around 76.5- 74.2 and the all-time low of 71. I will be surprised if the world does not slip into a currency crisis below 71 Dollar Index. Until that happens, enjoy and embrace the ride in the stock markets around the world while being prepared for the future.
Yet another fakeout?
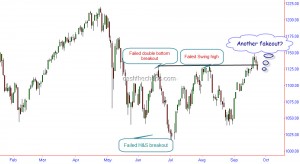
Yesterday's drop in the S&P 500 below the breakout level of 1129 is once again looking like a failed breakout. As highlighted in my September 2nd post there have been 3 fake out's since June already.
And each of these fake out's have resulted in a 6-8% move in the opposite direction. As highlighted in the inverse head and shoulder post, the volumes were already looking suspect and this drop back into previous range will give some powder for the bears. Near term supports at 1105 and 1090 must hold else the risk of yet another swing to 1040/1010 are on the cards.
