Jan 242011
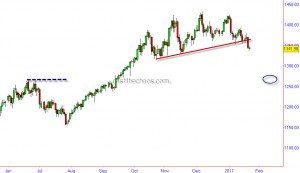
Gold broke through a short-term trendline and has opened up potential for downsides. (If you see our last few posts on Gold, we have been anticipating this decline.)
If you are a wave fan, you would note that this decline is coming after a 5 wave advance and this decline below 1352 marks the beginning of a strong decline. We are expecting the shiny metal to find initial support around the June highs of 1265.
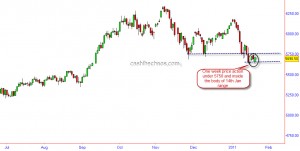
The Indian stock markets though had an advancing week, people have to pay attention to the range of last week.
The whole of last week markets meandered under the range of previous Friday's(the day it breached key support at 5690) range!!! If this is not bearish consolidation, what is??


Sorry, the comment form is closed at this time.