Jun 302010
 

The Grand Daddy of technical analysis, the Dow Theory,  indicated that the US markets have slipped into a primary down trend - in other words known as a bear market. The Dow Industrials closed below its May trough of 9810, a day after the Dow Transportation Index closed below its May trough of 4034. I'm not even going to bother with the charts as I'm sure the internet is filled with this news.

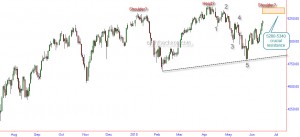
In this process, US markets have also completed the H&S pattern we highlighted in our June 15th post https://www.cashthechaos.com/blog/?p=261

In the extreme short-term, US markets could be in for a bounce as the Nasdaq has had 8 consecutive down days and the Dow and S&P 7 down days in 8. While such a bounce is not a guarantee, if it occurs, it would be an opportunity to get short and get out of longs positions if any.

Indian markets which have shown tremendous resilience and outperformed world markets so far, may not do so for long.  Expect more intense selling pressure next time Nifty trades below 5259.
Bonds breaking out

 Uncategorized  Comments Off on Bonds breaking out
Jun 292010
 

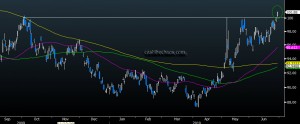
The chart below is that of  US bond ETF.  The breakout here is quite obvious and significant.

20+ year Treasury Bond fund - Source Bloomberg

Looking at India's 5yr interest rate swaps - a downward trend seems to have been established.

5year Interest rate swaps - Source Bloomberg

The message is quite straight forward:  investors are seeking the safety of bonds and hence another wave of selling in the equity markets is likely.

 Posted by at 6:49 pm  Tagged with:
Jun 282010
 

As can seen from the chart below, a gravestone Doji formation is visible on Nifty's weekly chart.

Nifty weekly chart - Source Bloomberg

This pattern is moderately bearish and a follow up selling this week(Friday's close) that takes Nifty below the low of 5259 would draw in more sellers.  Aggressive strategy would be to sell below the low of last week while a conservative approach would be to wait for this week's close to see if there is a bearish reiteration. A close above the high of 5366 would nullify the bearish signal.

USDINR reclaims 200 DMA

 Uncategorized  Comments Off on USDINR reclaims 200 DMA
Jun 252010
 

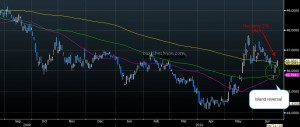
After a bout of choppy trading in the last 2 weeks, the USDINR pair closed above its 200 DMA.  The point to take note here is that the pair crossed  this level after registering a island reversal and is a pointer to further strength for the dollar against the rupee in the coming days.

USDINR Daily Chart - Source Bloomberg

Jun 152010
 

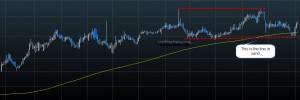
Yesterday's close above 5200 on the Nifty does bring in some positives for the index but the bears may not have surrendered their last line of defence.

Nifty - Daily Chart

As can be seen from the above chart, the correction from the April highs to 4786 has happened in a 5 swing fashion - usually an indication that it is part of a larger correction. Also, potential for a head & shoulder top exists for the Nifty if it does not push through the resistance zone (shown shaded on chart).

Hence the bears may have dropped the advantage they had since April but their last line of defence may still be in place.

The potential for a head & shoulder reversal can also be seen on S&P 500.

S&P 500 Daily Chart - Data and Chart courtesy Bloomberg

So until further clarity surfaces, one may either sit on their hands  or may stay hedged on their short and long trades.

Jun 132010
 

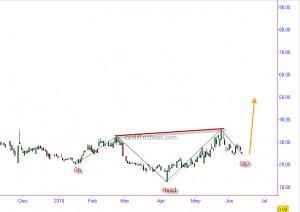
Here is the chart of India VIX. A reverse head and shoulder seems to be under construction.

What is important to note here is that the pattern formation is taking place after a very low reading on the VIX (read complacency). Once the reading crosses the neckline (35-36 level) a lot more volatility may be on the cards. A chart to keep tabs on.

Jun 072010
 

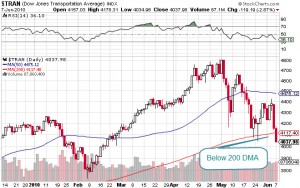
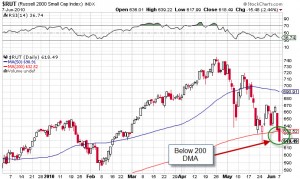
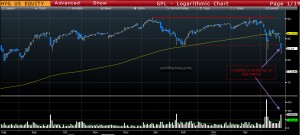
The Dow Transports and the small cap Russell 2000 closed below their respective 200 DMA.  These were the 2 important indices that held above this much tracked level all through the Month of May and this could mark another significant breakdown in the US markets.

Dow Transportation - Daily Chart

Russell 2000 - Daily Chart

As long as the Transportation index was holding above its 200 DMA the chances of recovery remained. Now with this move, those chances have gone up in smoke.

The small cap russell is a good measure of risk preference of investors. Once again, with a close below 200 DMA, the risk taking appetite has probably been flushed down the drain.

While Indian markets have been the best performer during the current decline amongst the BRIC countries - this may very well become the reason for a more pronounced sell off, as short sellers start targeting the out-performers.

For those interested, here is what I had said on CNBC this morning:

httpv://www.youtube.com/watch?v=cMtp9s7b20g

Jun 032010
 

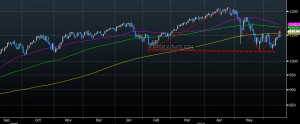
So far the Indian markets decline has stayed within the bounds of a correction and much similar to the previous two corrections - roughly a 12% drop from the highs.

Nifty Daily chart - Source Bloomberg

However this time around, there are a few variations. There has been considerable technical damage in many of the world indices and some have even topped out.

More importantly, one of my derived indicators that I use to measure the health of the indian markets, came very close to throwing  a market top signal. And this will be the indicator I will be keeping an eye on for the next few days to a few weeks.

Indian Economy barometer - data and charts bloomberg

This indicator has a stellar track record - it either  leads or is coincident with the market topping out process. Obviously, I will not reveal what or how this indicator is derived 🙂

 Posted by at 7:51 am

More bearish signs from the bond markets

 Uncategorized  Comments Off on More bearish signs from the bond markets
May 212010
 

In our April 28th Global Technicals, we had highlighted the potential for a double top in high yield corporate bonds. In yesterday's price action, the double top potential was realised as the ETF plunged through its previous trough low.

High yield corporate Bond fund (HYG) - Data and Chart from Bloomberg

This breakout signals that a collapse in the junk bonds is in the horizon. In other words the problems are mounting for the neediest borrowers and they are going to find it extremely hard to find willing lenders. While this clearly means risk aversion, there are other questions that are popping up. Could this mean there could be an increase in commercial delinquency? Or A double dip recession? Well, one has to wait and watch.

 Posted by at 2:05 pm

A potential trend reversal for the INR

 Uncategorized  Comments Off on A potential trend reversal for the INR
May 192010
 

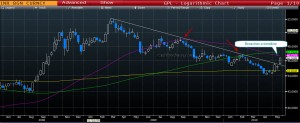
Today's price action in the Indian currency has put a question mark on the bullish price objective of 41.5-42.0 that we have been maintaining since last year. In today's trading, the USDINR closed above an intermediate term trend-line (see chart) that had kept the rupee's strength going.

Rupee weekly chart - Source Bloomberg

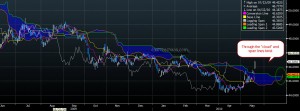
Looking at the Ichimoku charts,  the currency has overcome the "cloud" resistance on its daily charts. Also, a span twist is visible (green circle) which is another bullish sign for the USDINR (bearish for the rupee). All these price actions have transpired on the day when the Indian Nifty has closed below its 200 DMA for the first time since April 2009  - a sign that FII's may be heading for the door. Considering the above technical evidence, we expect Rupee to test the support of 47.6-47.8  in the short to medium term.

INR Daily Chart - Source Bloomberg

The longer term Elliot Wave count for the INR seems to suggest that what we saw from 52.18-44.05 may have been just a wave 4 and the current move could be the start of a wave 5 that could go on to test the level of 52. Although this is too early, we will keep this at the back of our minds.