Nov 242010
 

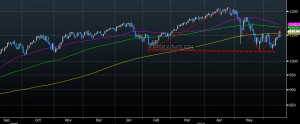
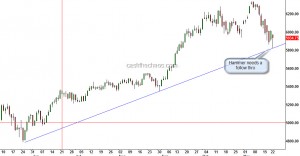
The boundaries of yesterday's low and high marked an important level in many global markets. On Sensex/Nifty yesterday's low is of significance. It was not just a 'hammer' pattern - the low also came of an important trendline.

Nifty - Daily Charts

The trendline is more perfect if drawn on the Sensex, we can connect the lows of March 2009  through these significant lows. A close below yesterday's low can make things turn nasty and that makes yesterday's low a must hold.

Correction or trend reversal?

 Uncategorized  Comments Off on Correction or trend reversal?
Nov 152010
 

In June, I had posted a note on this indicator and wanted us all to keep an eye on it. However, the indicator averted a double top risk and stayed above the previous trough during the May-June correction. Once again its time to keep an eye here. If this indicator dips below the orange line, it would be first warning sign that the existing uptrend is starting to turn weak. Although the possibility of a trend reversal exits only below the red line. I will post an update on this indicator if the indicator dips below either of these two levels.

Indian economy barometer

However, this time around there are couple of things that are loaded in favour of the bearish camp. One, Reliance is an under performer unlike the previous time. Two, SBI, a key leader in this rally, has also started to show pronounced weakness. Thirdly, there is a pronounced negative divergence on Nifty/Sensex daily charts.

What's favouring the bulls? The longer term momentum has matched with the price peaks and one possible wave count points to another leg up (need not result in a  high though).

Channel lines puts pressure on Nifty

 Uncategorized  Comments Off on Channel lines puts pressure on Nifty
Aug 272010
 

First post from Singapore - settling down here took a bit longer than anticipated. OK, back to markets 🙂

As can be seen from the chart below, the channel lines are putting pressure on the Nifty.
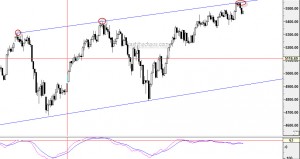
Nifty Daily Chart

Also, momentum peaks continues to disagree with the new price highs.

In my March 8th post, I had projected that Nifty should reach a minimum target in the region of 5600 but we dropped that stance in April expecting a correlated breakdown along with US markets. After initially declining to 4800 on the Nifty, Indian markets showed great resilience and outperformed almost every market in the world. So what has this got to do in the current context? The current high of Nifty satisfies the minimum level required for wave 5 completion (approx equals wave 1). Also, if Nifty closes below 5452 today (farther from this the stronger the signal ), a moderately negative to highly negative candle will be formed on the weekly charts.

Looking at the USDINR crosses, a symmetrical triangle seems to be in play and the upper borders of this triangle shares a common boundary with a medium term trendline.  A convincing move above this level will mean more weakness for the Indian currency and as a corollary further weakness for the stock markets.
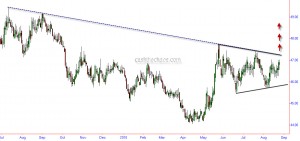
USDINR Daily Chart

My guess is that the Rupee will hit the upper borders today and pull back into somewhere into middle of the triangle to lower borders of the triangle, gather steam and then push past the 47.15 breakout level. If this scenario pans out - there might another push towards the high for the Nifty after the current decline. Let us see how the market pans out.

We were more focussed about going to cash and buying OTM puts as protection rather than going short between April and July. Considering that September is historically one of the weakest months, we will consider being short in a small way and try to build on them if situation warrants.
Jul 152010
 

Here is a chart of Indian Nifty in Dollar adjusted value.

Nifty daily chart - Dollar adjusted value

As is obvious from the above chart, Nifty has not even crossed the June highs, leave alone the April highs. And this could be the completion of a right shoulder in a head and shoulder top. While Nifty could very well continue to push higher and cross the highs of April in dollar terms- but other technical evidences at the moment do not favour that scenario. I guess by the time I post my next update from Singapore, markets should  have more evidence of which way they are headed.

Good trading to all!

Jul 052010
 

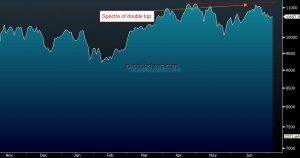
For the first time since 2009 cracks have started to appear amongst India's banking stocks. ICICI bank is showing considerable weakness and a close below 815 may weigh heavily on the banking index. HDFC bank is showing potential for a double top - of course this is not fatalistic but a close above 2025 will neutralise the negatives. A prudent investor/trader must watch the Bankex Index for clues to how the Indian markets are going to resolve.

BSE Bankex Line chart - Source Bloomberg

A close below 10100 for the Bankex would be a warning sign for further weakness in Banks and as a consequence for the broader indices - Nifty and Sensex.

Jun 282010
 

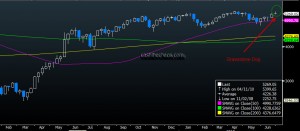
As can seen from the chart below, a gravestone Doji formation is visible on Nifty's weekly chart.

Nifty weekly chart - Source Bloomberg

This pattern is moderately bearish and a follow up selling this week(Friday's close) that takes Nifty below the low of 5259 would draw in more sellers.  Aggressive strategy would be to sell below the low of last week while a conservative approach would be to wait for this week's close to see if there is a bearish reiteration. A close above the high of 5366 would nullify the bearish signal.

Jun 152010
 

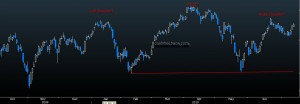
Yesterday's close above 5200 on the Nifty does bring in some positives for the index but the bears may not have surrendered their last line of defence.

Nifty - Daily Chart

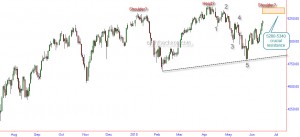
As can be seen from the above chart, the correction from the April highs to 4786 has happened in a 5 swing fashion - usually an indication that it is part of a larger correction. Also, potential for a head & shoulder top exists for the Nifty if it does not push through the resistance zone (shown shaded on chart).

Hence the bears may have dropped the advantage they had since April but their last line of defence may still be in place.

The potential for a head & shoulder reversal can also be seen on S&P 500.

S&P 500 Daily Chart - Data and Chart courtesy Bloomberg

So until further clarity surfaces, one may either sit on their hands  or may stay hedged on their short and long trades.

Nifty on a new channel

 Uncategorized  Comments Off on Nifty on a new channel
Mar 082010
 
Nifty

Channelled move

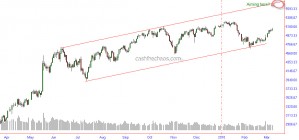
After 4 successive weeks of gains, the 5th week has also started off on a winning note for the Nifty. Excepting 2008, whenever the broad markets have clocked 4 successive weeks of gains, my visual analysis of Nifty and Sensex tells me that markets are embarking on a powerful rally.

At the very least one can expect Nifty to scale the upper borders of the channel shown above in the charts, currently in the region of 5600.