Jul 192011
 

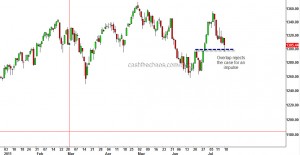
Yesterday's session for the US markets was an important one. If the fall from the May highs was corrective yesterday's low on the S&P 500 should have stayed above 1298. The fact that it did drop to 1296 is an indication the rally from the June lows was possibly an artificial rally manufactured by the powers that be. If you know a little bit of Elliott Wave you would know why this area should not have overlapped.

S&P 500 Daily Chart

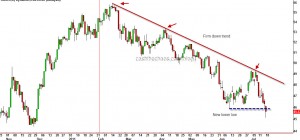
Also the Phily Banking index, nose dived below the June lows.

Philadelphia Banking Index

We already have a Dow theory non-confirmation in July - transports made a new high while the Industrials did not. So if these interpretations are correct, over the next few days we should see further down sides for the S&P which potentially could go below the June low of 1258.
Jul 112011
 

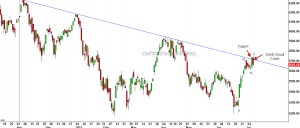
On Friday, India's benchmark Nifty saw some brisk selling and markets finished near the lows of the day. The selling pressure  reversed 75% of the previous session's gain and thereby producing the technical pattern known as "Dark Cloud Cover" (DCC) on the daily charts.

Nifty - Daily Chart

Questions that come up: (1) was Thursday's thrust above the medium trendline connecting through November_January highs a fake-out? (2) Is it going to beget further selling; (3) How does one position - buy the dip or sell the rip?

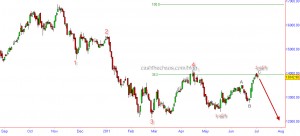
I wish the answers were plain and simple. The Nifty is in the midst of a very complex correction.  There are various ways to interpret the movement that has come off the June low of 5195. What is however clear, whether one is bullish or bearish is that, that a decline is under way and only the amplitude is in question. At 5735, wave v was equal to wave i (see chart for labelling), which is a normal ending relationship. So the high at 5740 was just 5 points over the ideal scenario. If the current decline continues beyond 5480-70 zone, the odds that the high at 5740 was a head-fake would increase. As long as Nifty holds this zone of 5480-70, I see this corrective rise having potential to make an attempt at more push higher which may end slightly above 5750 or fail at 5750.

If I were a nimble trader with 1-3 day time frame, I would trade banks and cap goods from the negative side. I were a conservative trader, I would stay very light until Nifty drops to 5480 or breaches 5750.

Jul 052011
 

The chart below is the Elliot Wave structure of the BSE Capital goods sector:

BSE Cap Goods - Daily Chart with EW Count

The capital goods sector looks set for a sharp decline - potentially embarking on its 3rd sub-division of its 5th wave, which usually tends to be a powerful leg. The sector is also reacting from its 38.2% fibonacci retracement level of its decline from November to May. We would all recall that along with Banks this was a market leader on the way down from Nifty 6338 peak made last year. If my interpretation of the wave structure is right, we should see this index decline to about 12000 from its current level of 13842. The sector leader LT is reacting lower from its 50% Fibonacci retracement level and BHEL too, one of the weakest in this space, is about to establish a downward trendline. Look out below?

 Posted by at 3:16 am  Tagged with: ,