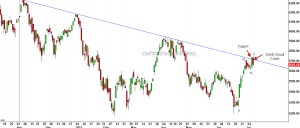
On Friday, India's benchmark Nifty saw some brisk selling and markets finished near the lows of the day. The selling pressure reversed 75% of the previous session's gain and thereby producing the technical pattern known as "Dark Cloud Cover" (DCC) on the daily charts.
Questions that come up: (1) was Thursday's thrust above the medium trendline connecting through November_January highs a fake-out? (2) Is it going to beget further selling; (3) How does one position - buy the dip or sell the rip?
I wish the answers were plain and simple. The Nifty is in the midst of a very complex correction. There are various ways to interpret the movement that has come off the June low of 5195. What is however clear, whether one is bullish or bearish is that, that a decline is under way and only the amplitude is in question. At 5735, wave v was equal to wave i (see chart for labelling), which is a normal ending relationship. So the high at 5740 was just 5 points over the ideal scenario. If the current decline continues beyond 5480-70 zone, the odds that the high at 5740 was a head-fake would increase. As long as Nifty holds this zone of 5480-70, I see this corrective rise having potential to make an attempt at more push higher which may end slightly above 5750 or fail at 5750.
If I were a nimble trader with 1-3 day time frame, I would trade banks and cap goods from the negative side. I were a conservative trader, I would stay very light until Nifty drops to 5480 or breaches 5750.
