Feb 282011
 

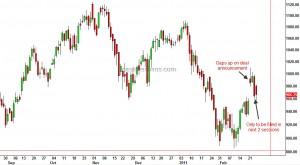
When Reliance announced the deal with BP there was quite a bit of excitement amongst the analyst community. Some even thought this was a game changer for the stock. But here is the stock dipping under the pre-deal announcement levels.

Reliance - Daily Chart

If the stock closes Rs 10 under Friday's close, the deal essentially would mean nothing for the stock! What is quite obvious from the chart is that the gap resulted on February 22nd is nothing but a common gap and has very little potential, if any, to reverse the down-trend of the stock.
Feb 182011
 

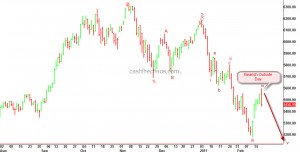
The relief rally for the Nifty that began from the lows of February 11th, ended today with a strong reversal bar. As can be seen from the chart below, today's price action shows a rejection of the early highs and sellers have overpowered the buying pressure of the previous day too. This bearish outside day is marked on the chart.

Nifty - Daily charts

If my Elliott wave labelling is correct, Nifty should decline to a minimum of 5115 in the near term - could be even as quick as 2 weeks or less.

Feb 112011
 

If you have been following my views on business channels, you would know that I have been saying for quite some time now that the decline in stock markets is not just restricted to one or two stock markets in the world. Many markets, frontier and emerging have been taking it in on their chin.

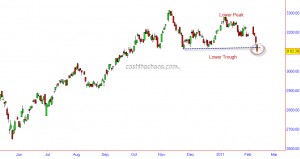
Yesterday, Singapore's STI joined the list of stock indices that have slipped into bear market territory.

The index ploughed through its previous trough and clocked lower top and lower bottom. The Hang Seng Index too is just within a hair's breadth of clocking lower lows and lower highs. A close for the Hang Seng Index below 22620( 88 points below yesterday's close) and this index can also be marked as having entered a bear market. The contagion is spreading.

Raw Sugar – Topped out?

 Commodities  Comments Off on Raw Sugar – Topped out?
Feb 092011
 

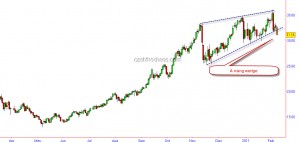
Raw Sugar had been on a tear and the run may have come an end. The chart below shows the commodity breaking out of a rising wedge.

Raw Sugar - Daily Charts

Wedges are ending patterns and have a fairly high degree of reliability. Also from May lows, I can count 5 waves to the February highs and Wave 5 is 1.6 times Wave 1 which is a Fibonacci relationship. If the commodity declines quickly over the next couple sessions, this would be a reiteration of this sell signal. Very interestingly, Raw Sugar has some seasonal cycle working for the last few years around February - top in 2010, 2008, 2006, 2003 secondary top in 2007, 2005 and bottom in 2004 and 2000.

Dollar Index – another bounce on the cards?

 US Markets  Comments Off on Dollar Index – another bounce on the cards?
Feb 072011
 

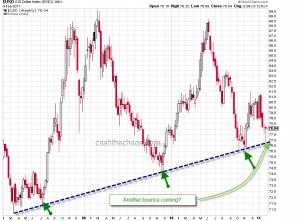
The trendline highlighted on the weekly charts has been a solid support for the Dollar Index despite consistent efforts by the Federal reserve to debase the currency.

Dolla Index - Weekly Charts

An ascent past 78.8-79 would increase the odds of this rally having more legs and clearing the 200 MA( currently placed at 81.61). The much awaited correction for the US markets could be close and those emerging markets stocks which have already been battered (like India) are likely to head even lower.