Keep these stock on your watchlist

 Indian Market/Stocks  Comments Off on Keep these stock on your watchlist
Jan 132011
 

The first one is the heavy weight ONGC

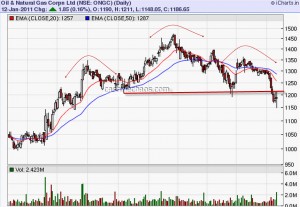
ONGC Daily Charts

IMO, this is not a perfect H&S top, as the volumes have not been supportive of the dip below the neckline. Nevertheless,  due to its high weightage in Nifty and fact that the stock is clocking lower highs and lower lows, it deserves our close attention.

Next is the cement major, ACC.

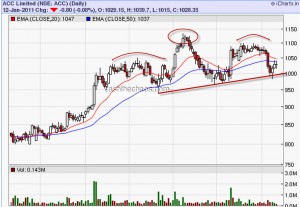
ACC Daily Charts

A close below the 1000 level with expanding volumes would give the bears the upper hand in this sector.

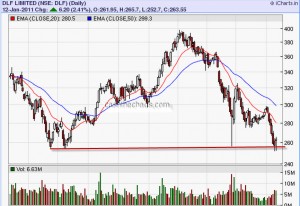
The third one is the real estate major DLF.

DLF Daily Charts

The stock is hanging by a fingernail above its major support of 255. Although DLF did dip below that level on an intraday basis, it managed to close above that level and averted a major disaster here.

If any of these stocks close below the levels marked here, the bears will have more ammunition to launch their assault on the broader market.
Axis Bank – a trend reversal?

 Indian Market/Stocks  Comments Off on Axis Bank – a trend reversal?
Nov 222010
 

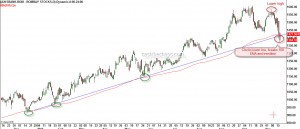
For the first time in since March 09, Axis Bank has clocked a lower high, lower low pattern. This is shown in the chart below.

Axis Bank - Daily Charts

Also visible on the charts, is the break of an important trendline and 100 day exponential MA. The green circles on the chart highlights how these levels acted as supports during prior declines.  A breach of these levels along with a lower low, lower high pattern is a clear warning signal that the risk has grown for those holding longs. Ideally, I will look to enter short positions on a small rise.

A similar breach is visible on BPCL (no trendlines though).

Bajaj Holdings breaks out

 Indian Market/Stocks  Comments Off on Bajaj Holdings breaks out
Nov 022010
 

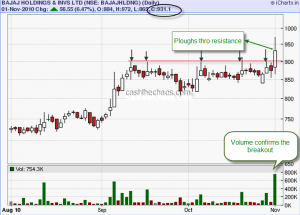
Bajaj Holdings - Daily Chart

If I were to go long here, I would place my stop below 800 at close and I would let my profit run. I do think 1200 should be an easy objective for this move.

Watch out for Central Bank

 Indian Market/Stocks  Comments Off on Watch out for Central Bank
Oct 212010
 

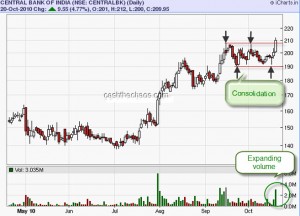
When a stock breaks out of a range, it often provides one of the best trading opportunity. When that happens on a day when the broad indices are falling, the stock deserves even more attention. The price action of Central Bank highlights this scenario. After a smart consolidation between 209 and 190, the stock has broken out of this range with expanding volumes on a day when Nifty ended 0.75% in the red. This stock is likely to be a mover in the next few days and may be over the next couple of weeks.

Central Bank - Daily Charts

Sun TV risks a double top

 Indian Market/Stocks  Comments Off on Sun TV risks a double top
Oct 082010
 

Sun TV - Daily Chart

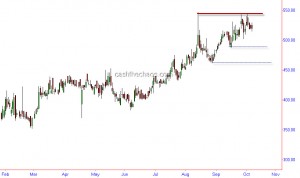
The daily chart of Sun TV (above) shows the possibility of a double top formation. However, it does not mean the stock will not cross 547-550 resistance, but the odds are against it. The double top potential would be realised only below 461. Once the stock starts trading below first support of 489 weakness is likely to set in. Hence, a prudent trader should wait for weakness to set in before attempting to short this stock.