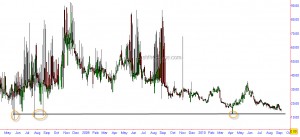
The readings on NSE India VIX are approaching extreme levels. Although they haven't yet reached the most extreme readings since its inception but it is at its lowest readings on a closing basis. The current level of complacency is much more than it was during the January 2010 highs.
As can be seen from the chart above such low readings have often corresponded to significant peaks of April highs, July/Aug 08 highs and May 08 highs. Had it not been for the limited history of India VIX, I will be sitting with a bucket load of puts. But being a conservative trader, I prefer to act on things with much longer history. If aggression is your cup of tea here is a chance to pre-empt the market. Nevertheless, this is a chart that might be worth every trader's attention.
