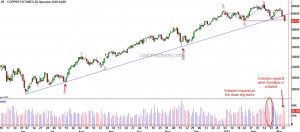
Copper, which is often considered a proxy for the global growth, dropped through some important support levels.
The intermediate term trendline from June lows, which was holding up this market, gave way along with expanding volumes. The move from June lows to the November highs is a clear 5 wave pattern and the 5th wave is also related to the 1st wave by a Fibonacci ratio - a normal ending wave relationship. Also noticeable on the charts is the volume expansion as the red metal declined from its February highs.
The blue dotted line shown on the charts could be considered as a Head and Shoulders top and the breach of 424 price level would become the breach of the neckline that completes this pattern.
Considering all the above evidences, it does look like the metallic professor is saying the winds of change are here for the global economy. Expect the S&P 500 to drop below 1294 swing low in the immediate future which in turn is likely to result in a larger decline.
