Jan 182012
 

Nifty(4967): Nifty had another up day and pierced through resistance at 4920-50 zone. As labelled on Monday, there was some doubts over the end of the C wave , which is why we had an OR c label and this exactly why we called for some additional patience yesterday. As the market goes higher, it pushes the sentiment one sided and emboldens the late buyers. The next resistance for Nifty is at 5022 and Nifty is still maintaining the bearish configuration of 5 down 3 up mentioned on Monday (click here).

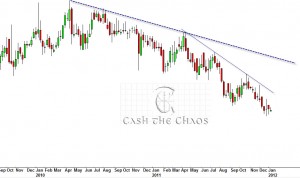
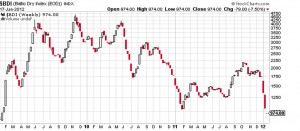
The important development over the last two-three weeks - probably very few have taken note or even aware is the baltic dry index.

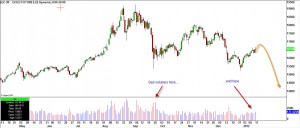
Baltic dry index - weekly chart

The index has dropped precipitously over the last fortnight, shaving off a nasty 50%. This does not augur well for the world economy. There might be delay in equity markets reaction but it will react soon as this often tends to lead equity market moves.

So as far Nifty is concerned the conservative trade is to wait for overlap at 4800 or an one day reversal that tells that overlap of 4800 is coming. Patience is a virtue and it will reward handsomely - sit on your hands. If you can't keep your thumbs down, go for an out of the money put in small quantity but remember you would be preempting the market if you did that.

Some of you  are curious about gold - NO it has not formed a double bottom.... yet. It is a double bottom IF AND ONLY IF it goes above 1805.

Gold - Daily charts

As can be seen from the chart above Gold is rising with much lower volumes. This is not a bullish sign. After a small bump Gold is set to resume lower. Ill keep it very simple without getting technical. Dollar Index is unlikely to drop below 79.5 and head to 85 by Feb March. Can gold suddenly decouple from Dollar and move up with Dollar? It can but extremely unlikely. The same holds for silver. QED
 Posted by at 3:21 am
Jan 172012
 

Nifty(4873): Not much changed from yesterday's price action. The same conditions prevail. Either Nifty's corrective rally is ending or there is little bit of steam left (see yesterday's chart).

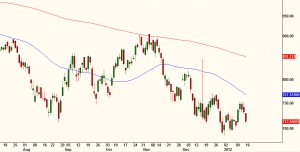
Reliance Daily Chart

The above chart is that of Reliance - the stock is hovering near its 52 week low and has not even been able to mount a corrective rally to its 50 DMA.

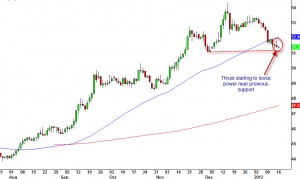
INR daily charts

Also the Indian rupee is starting to loose strength. On the chart above, the red line is an important support for the Dollar. The candles here are starting grow smaller and signals loss in fire power for further strength for the Indian rupee. A reversal bar here will be an ideal entry for Long Dollar against the rupee.

Be patient, the market will present a juicy shorting opportunity.

Support for Nifty: 4800 Resistance 4920-4950.

 Posted by at 3:21 am
Jan 162012
 

Well I had a nice holiday, hope you all did too.

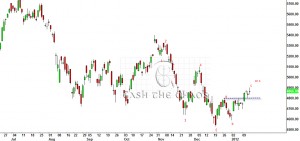
Nifty(4866): Most of the BRIC markets have had a nice start to 2012 and India is up a tidy 4.5%. So, many of you might want to know if things have turned a corner. Here is my prop indicator which signalled the start of a bearish phase for India in November 2010:

India Barometer

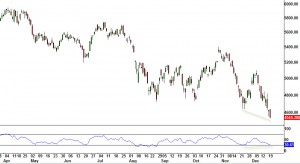
As can be seen from the chart above, the indicator is continuing to clock lower lows and is accelerating lower. The best the bulls could hope for is that, this indicator this time is going to be concurrent rather than lead the market.

The pattern on Nifty still resembles a 5 wave down move followed by a 3 wave correction. This is still a bearish configuration. A drop to 4800-4775 will be a confirmation of this bearish set up.

Nifty Daily Charts

So at 4800-4775 , we will look for shorting opportunity. Frontline banks are likely to come under pressure. Support for Nifty 4800 and Resistance kicks in at 4920-4950.

 Posted by at 12:28 am
Dec 222011
 

Nifty(4693.15) Markets staged big rally of 3.2% from the important support of 4530. Remember, one day does not make a trend and sustainability and follow through are hall marks of a trend. Shanghai composite has hit yet another new 52 week low this morning. Let us see how long the window dressing for Nifty lasts. If Nifty heads below 4600, yesterday's low, it will be clear indication of a shallow correction having come to an end.

Nifty hourly charts

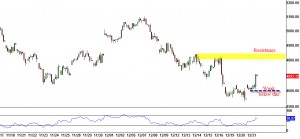
Before we get too aggressive on the short side, we would like to see additional clues for the short term. However, the medium term trend is strongly down. Resistance(marked in yellow) 4810-4840 is going to be formidable in the event Nifty manages to conquer 4730. Support is at 4530 and a breach of this would signal a move to 4380.

Open position: Short Indusind @267 (partial profits taken)

 Posted by at 3:19 am
Dec 212011
 

Nifty(4544): We have a positive divergence on the intraday charts and the 4530 support has proven its strength for the moment. The SGX nifty is pointing to a nice 1.5% pop at the open.

Nifty hourly charts

Over the last several weeks there has been considerable amount price action around the 4720-30 zone. Watch for resistance to kick in this area. If market does stretch through this then expect the Friday high of 4820 to act as the supply zone. Due to holiday season, volumes could be thin and the year end window dressing by funds to prop up NAV may keep this market afloat for a while. Be flexible and stay nimble.

Resistance: 4720-30; 4820 and Support: 4530 and 4380

Open positions: Short Heromotors from 2025 (booked at 1938 and reloaded at 1910) and Short Indusind from 267 (partially booked at 239)

 Posted by at 3:17 am
Dec 202011
 

Nifty(4613): The decline from Friday continued and Nifty pushed closer to our projected support of 4530. There was some erratic moves later in the day and markets saw a mild recovery and finished the day paring some of the losses.

Nifty intra charts

From the chart, we have not seen any divergence to indicate that the move is ending but we have to be a little flexible here about taking our profits, a little early. First, the momentum on the daily charts is yet to dip below the level registered when markets hit 4640 in November. Second, there is a hammer pattern on daily charts - this can fail and needs follow up buying to confirm. Third, in the smaller degree we are assuming we are in the fifth wave which is often known for failure to reach ideal levels. So let us keep these in mind.

In the bigger picture though, recovery if any, is likely to be temporary and the broad trend is still strongly lower.

Open Positions:

1)Long Nifty 4500 Dec put @20-21

2) Short Induindbank from 267 (covered and reloaded at 254)

3) Short heromotors from 2025 (covered at 1938, reloaded at 1910)

4) Silver short from $34.2 (booked part at $31.4 and reloaded at $30.65) - Please book profits today at $28.8. When silver breaks $28.1 short again

 Posted by at 1:09 am
Dec 162011
 

Nifty(4746): Markets came within striking distance of breaking the 52 week low of 4639 but has seen a small bounce from 4673.  So far it does not look like down draft has ended. May be the policy decision today will be the trigger for a sell off. The extreme short term technicals is a bit fuzzy but as far as I can decipher, it does look like 4843 or 4910 is the maximum upside if this relief rally continues.

No new trading bets was taken yesterday.

 Posted by at 3:51 am
Dec 152011
 

Nifty(4763): In our last update we had expected Nifty to get a temporary reprieve from 4690-4720 zone and markets saw a temporary reprieve from 4728. It is likely that the this relief  is over. Remember the 2 days Nifty hit 4640? Nifty bounced back and closed above 4700 levels. The lowest closing was 4706. Now, 4706 will act as a bull-bear divide line. Bears need to cross this line to signal that a new low is coming. As mentioned last week, new low on or before 21st Dec seems very likely.

The forces of deflation is taking control of the global markets, and it will spare no asset class. This is exactly why we are short on Gold and Silver. Even crude is a short but we will look for a low risk entry.

New open position:

Long Nifty Dec 4500 Put at 20-21, price objective 80-100.

Note: On CNBC today at 8:40 IST

 Posted by at 2:18 am
Dec 132011
 

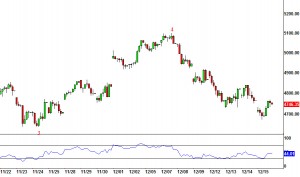
Nifty(4760.60): It has taken just 3 sessions to retrace a little over 3/4ths of the move from 4640 to 5100. The probability that wave ii of wave 5 ended on Friday itself and the markets are progressing in wave iii of wave 5 is quite high. In simple terms, the markets are in the most powerful leg of the move within in this decline is very likely.

Nifty hourly charts

If this is the case, the minimum measurement for this powerful leg works out to 4505. In the extreme short-term, market could find support in the region of 4690-4720 and have a small relief rally or it may just plunge straight through 4690 and go for the breach of 4640.

In other markets, Gold has breached an important support .

Gold Daily charts

Ill keep this very simple - as can be seen from the chart above, a trendline has been established (blue dashed line) and Gold went below its previous support of  1667. Overnight, there was also a strong rally for the dollar index. If you want to short Gold, the stop is $1770 on the front month contract (a few points above Dec 2 high if you use any other contract). I expect Gold to hit 1410-1380 atleast in the first 6 months of 2012. To be honest, Gold has whipsawed me on a couple of occasions and that is the only reason for not having an official trade here but this is a clean set up, atleast for the short-term.

Silver: We are already short from 34.2 and have taken part profits. If silver drops below 30.65, add back the same quantity you booked at $31.4 and revise stop to 33 as stop for a target of $26.

 Posted by at 3:27 am
Dec 122011
 

Nifty(4866.70): Markets took eight sessions to rally from 4640 to 5099 but it has just taken 2 sessions to wipe out a little over 50% of those gains.

Nifty intraday charts

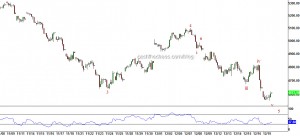
A relief rally now to something under 5000 mark would mark wave ii of the wave 5 (see chart). More specifically, the ideal level for this relief rally to end would be 4935 or 4980. So if our reading technical pattern of the intra-day chart is correct, a very powerful move (wave iii of 5) that challenges the Nov low of 4640 should evolve post this relief rally. As mentioned last week,  a new low on or before the 21st of December seems likely.

Supports: 4810 and 4640 Resistance: 4935 and 4980

 Posted by at 3:34 am