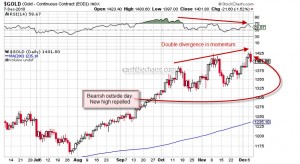
As can be seen from the above charts, the climb up for gold has been loosing lustre, at least for the intermediate term. Each successive peak has been on declining momentum.
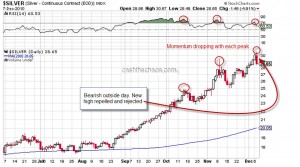
As one should expect the picture is similar for silver, double negative divergence just as in Gold. Also both these precious metals made new intraday highs only to be repelled lower and rejected by the market - a bearish outside day formation.
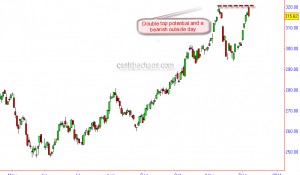
The CRB index has also formed a bearish outside day right the previous swing high and thereby raising the possibility of a double top formation.
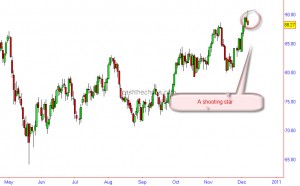
A shooting star pattern is visible on Nymex crude. The momentum here too has been diverging negatively with the price peaks.
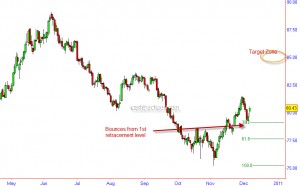
A look at the charts of the Dollar Index, shows that the Index has probably resumed its uptrend after a 3 day corrective decline. The index is bouncing from its first fibonacci retracement level. Over next 4-6 weeks a level of 85 is the price objective for this currency basket.
Barring an immediate reversal in the above markets( though not impossible), one should expect the negatives to start trickling into equity markets.
Sorry, the comment form is closed at this time.