Warning signs

 Indian Market/Stocks, US Markets, World Markets  Comments Off on Warning signs
Nov 012019
 

S&p 500:

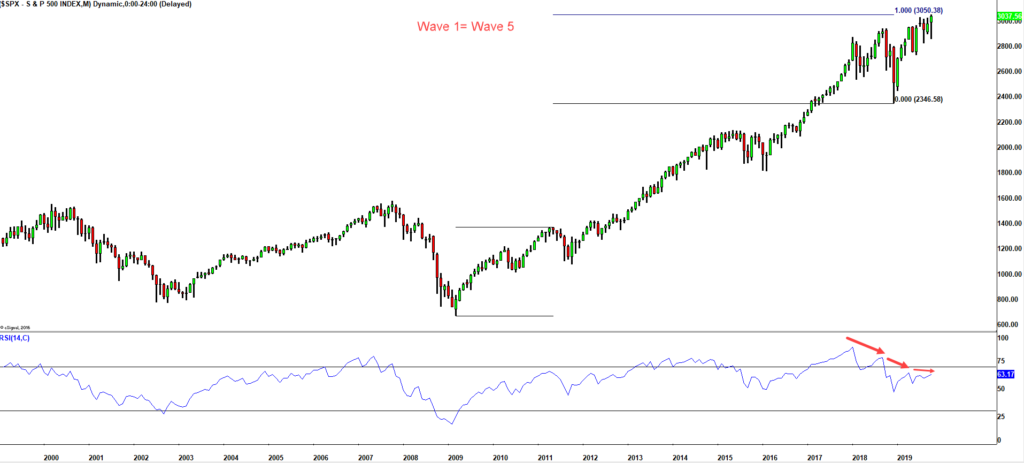
As can be seen from the monthly chart of S&P 500, the momentum for the Index has been dropping precipitously with each new high. (The loss of momentum is pretty much the same on Nasdaq & Dow as well). Under the Elliott Wave Model, I see the move from Dec 2018 as start of the 5th wave for S&P for the bull run that began in 2009. The wave principle states that two of the impulse waves tend towards equality. This is shown in the chart above.

Incidentally, Oct 2019 is 144 months from the high of financial crisis high - a very important Gann number. Invariably, significant highs and low's get registered from previous peaks and troughs (with a very tiny bit of tolerance on either side of this number)

Other Indices:

The Dow Jones Industrial is yet to clock record high. While it's not far off  and it may even clock fresh high in the next couple of days, it is lagging. We can even ignore this but:

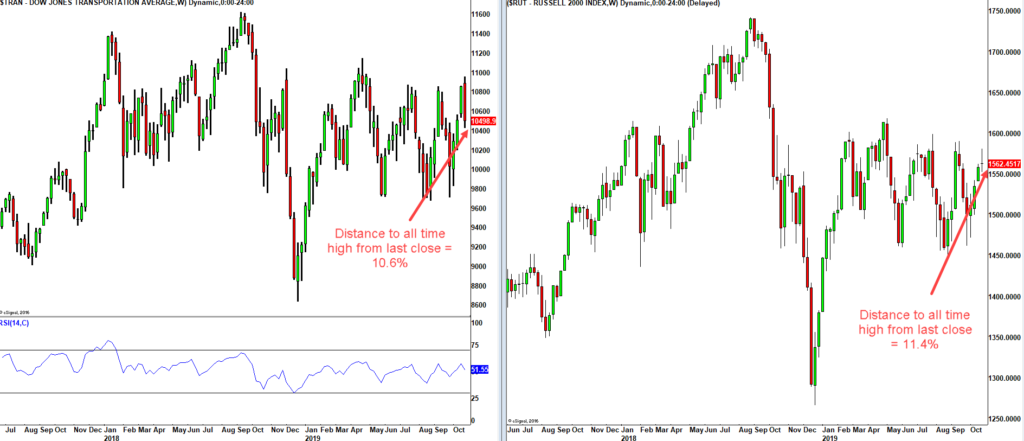
The Dow Transports and the small cap Russell 2000 (shown in the chart above) indices are over 10% from their record highs.

The famous FANG stocks which have been an important cog in this bull run are all lagging. Google while close to its all time high, failed to cross 1290 for the 3rd time. To clock fresh all time high - Netflix needs 45% +, Amazon 15% and Facebook 14%.

Sentiment:

At the record high of 3050 on the S&P reached couple of days back, the sentiment readings are very elevated. The number of futures traders who were bullish reached 80% (courtesy Daily Sentiment Index).  I've seen this reading go to 95% but this is at the extreme zone.

Here is another picture:

As I have shown on the monthly chart of  the S&P,  Wave 1 is right now = Wave 5. A sentiment equality could also be shaping up. In May 2011, Bin Laden was killed by US forces, post that , the S&P dropped 20%. Here just before the 3050 high, Al-Baghdadi has been killed by the US forces. This is once again being hailed as big amelioration of Geo-politcal risks for the market. Will history repeat?

I had spelt some of these thoughts on BQ here:
 Posted by at 4:10 am
Sep 292019
 

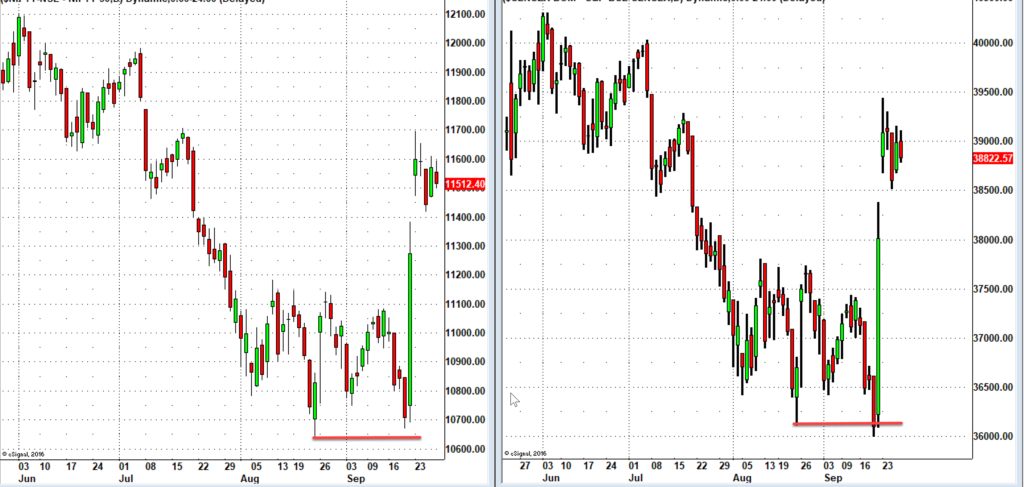
Indian equities have had an interesting 6 sessions of trade. The Sensex dropped below the Aug low while the Nifty barely managed to hold above the Aug low.

Chart 1: Nifty vs SensexNifty's price action of the last week has thrown up a couple of possibilities.

(a) Bull case:  My interpretation that the Index registered a major top in June 2019 was premature. OR

(b) Bear case: A major top is in place and the events of last week simply interrupted the decline.

If we consider (b) as the case, that leaves us with two possibilities. Either the index hasn't got much upside beyond the 11700-750 ball park or the index is going to fail just under the record high of 12103.

This leaves us with a couple of interpretation under the Elliott Wave model and in both cases, the bounce is a correction. Did the correction start from August low as an irregular correction or did the markets see a 'truncation' in September due to an unforeseen event is the question to be answered. (For those who want to get technical under EW, the decline from 12103 ended a five step minor degree A or 1 at the Aug/Sep low and markets are on a corrective minor degree 2 or B)

The important takeaway from this is that we need to be on guard - Indian equities could reverse suddenly without much warning as the upside could be done or very limited.

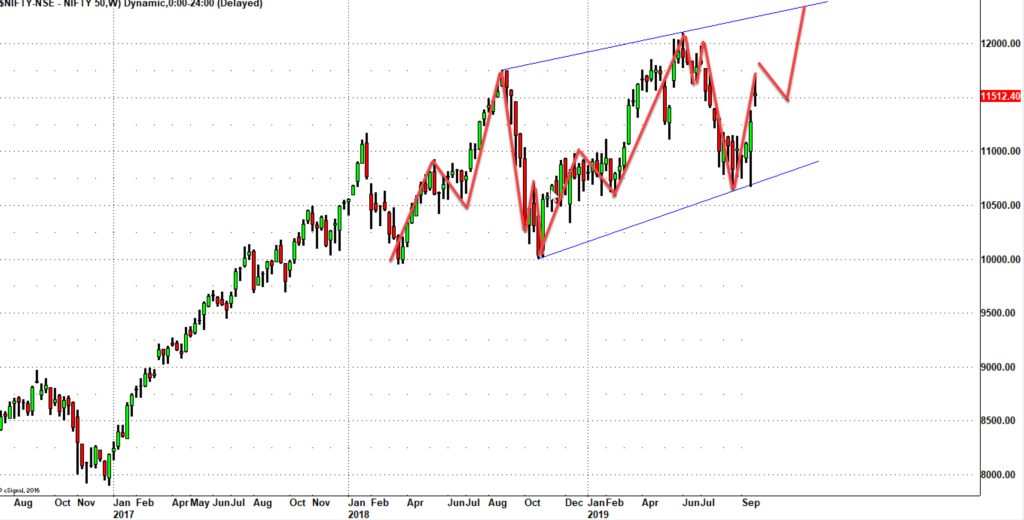
If we consider the case (a), the reasonable and sensible way to interpret the price action seems to be an ending contracting diagonal under the Elliott Wave model. Under this interpretation, the upsides are a little bit better but doesn't seem like one should build a big portfolio expecting a multi-year upside. The upsides may not last beyond a few weeks to a few months.

Chart 2: Nifty Weekly 3-3-3-3-3 ending diagonal

Bottom Line: To me, it makes eminent sense to wear a trader's hat and not an investor's hat.

 Posted by at 3:38 pm

PNB’s medium term outlook

 Indian Market/Stocks  Comments Off on PNB’s medium term outlook
Jan 052014
 

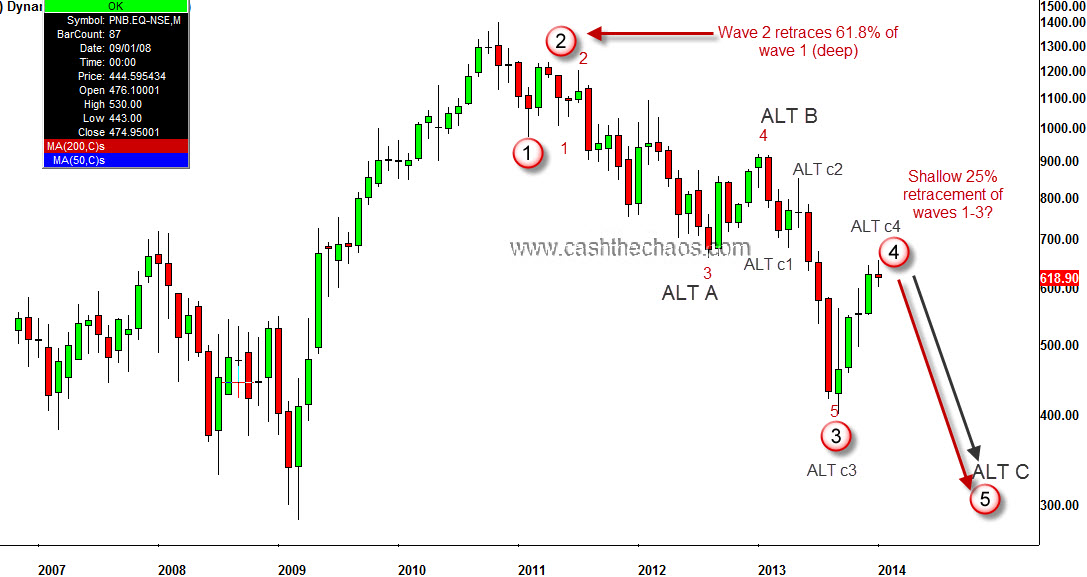
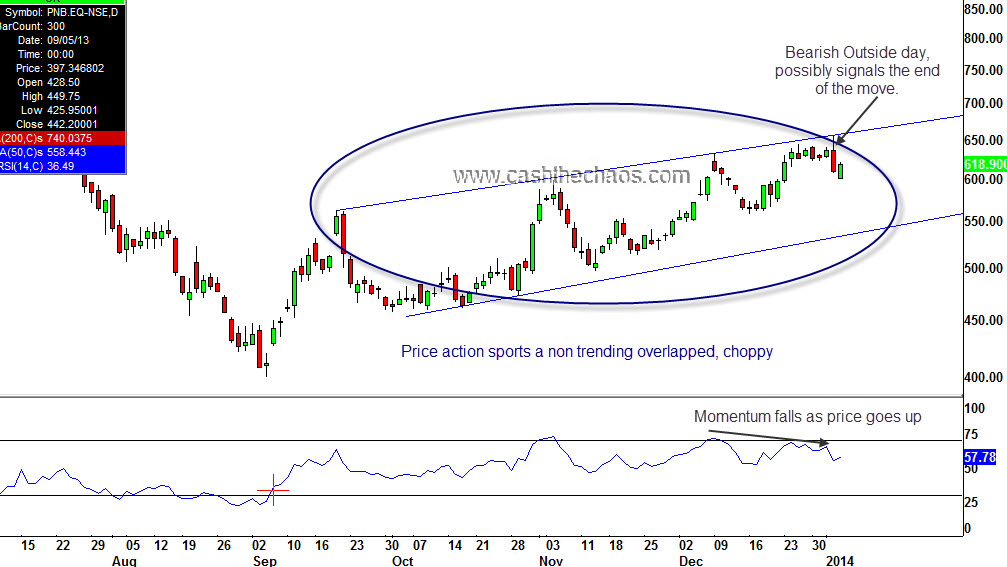
PNB has gained about 19% since the beginning of December. However, the rise from the September low seems to be just a corrective rise within a larger decline.

The monthly chart of PNB shown below sports a distinctive lower low and lower high pattern. From an Elliott Wave perspective, the decline from 2010 to 2013 September can be counted as waves 1 through 3.

On 2nd Jan the stock reached 654 and then fell sharply to register a bearish outside day. This level of 654 is a perfect 25% retracement of waves 1 through 3 which is a characteristic behavior of wave 4 after a strong wave 3.

On the daily time frame, the move since September is slow, choppy,  overlapping, contained within parallel lines - once again a characteristic behavior of a corrective rally.

Now if we see PNB drop below 600, it is likely that the 5th wave down has started for PNB and a decline to a minimum of 400 is underway. The confidence in this wave count will increase if PNB closes below 558 and also breaks the parallel channel.

So, what would I do as a trader? IF and ONLY if 600 is violated, I would consider going short with 682 cash level as a stop. Ideally using some just out of the money put (should be liquid and have a sensible premium) as a trading vehicle. After, 558 is taken out, I would consider getting more aggressive and hold for the medium term target of 375.

If however 654 is taken out before 600, the broader theme of a 5th wave decline would still be valid but I will let the upward correction continue to about 680-721 before looking to go short. (I will email you all and update in this scenario). The bottom line - medium term outlook is bearish and a move below the September 2013 low seems likely.

Legal Disclaimer: This post gives an idea of how a trader chooses low risk entry points for trading and hence what you see in this post is for educational purpose only. This is no solicitation to buy or sell securities. I'm not a registered investment advisor and if you decide to take action on the above idea, you are agreeing that you take full responsibility for the profit or loss that you may sustain based on such decisions and agreeing to indemnify the author of the same. You may have seen me on TV suggesting successful trade ideas but remember trading is inherently risky and past performance is no guarantee of future outcome.

PS: This was a premium digital content and has been unlocked. The trade setup resulted in partial profit taking on 31st Jan and balance position was stopped at cost on 6th March 2014.

 Posted by at 9:14 pm
Mar 302012
 

Nifty(5178): Nifty on expected lines went below the low of 5165. The bullish interpretation at this point is that the move from 5630 is a corrective decline and the correction got over at 5135. What is in favour of this? The intraday momentum has not been able to clock new lows when price has done so. However, on the higher time frame , daily charts, momentum is with price.

What's the bearish case - the market is in its third wave and the waves are sub-dividing in a 1, 2, 1, 2 fashion. INR is in favour of this scenario. Other currency cross-rates are favouring this outcome. China as pointed is bound for a big big low.

So we need to see Nifty stay below 5400 on the counter trend bounce. Quite possible it might not even cross 5320-5340. Today, being the end of a quarter - we might see some window dressing by FM's

The chart below shows the above scenario.

Nifty intra day chart

 Posted by at 8:59 am
Feb 272012
 

Nifty(5429):

Nifty Weekly charts

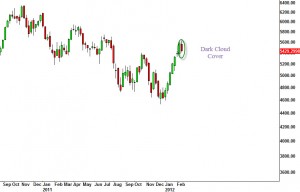
A dark cloud cover on weekly charts on Nifty - this a reliable pattern but we need to see a follow through to this pattern. Momentum agrees with price so far. So we must look for a corrective decline to 5200 or 5077.

IF we see a bounce to 5490-5510 in the first 2days of the week, it might shorting opportunity for the extreme short term.

Supports:5390, 5210 and 5077

 Posted by at 8:47 am
Feb 232012
 

Nifty(5505):

Nifty Daily chart

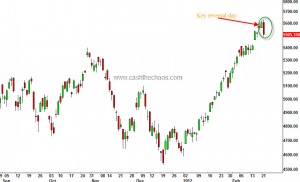
Indian benchmark indices saw a key reversal day on the indices (see chart above).  A new swing high followed by a strong rejection of the new high. This is usually very bearish but momentum points to an unfinished move.  So, we will prefer a corrective decline followed by a another leg up.

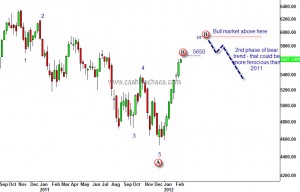
BUT, if we see a "FIVE" along with this correction, we may have to conclude differently. As shown in yesterday's chart, the bigger B wave can end either at 5650 or slightly below OR closer to 5975. Yesterday's high was very close to 5650. Keep tabs on USDINR - if it crosses 49.8 that would the first warning sign for Bulls that things may not be smooth for them.

Supports: 5480, 5325 and 5077 (so watch for correction to get some support here - I prefer a decline 5325 to 5077)

Resistance: 5650

 Posted by at 9:00 am
Feb 222012
 

Nifty(5607):

Nifty weekly charts

The above chart is the 'case 2' we had outlined several days back in this month's morning note. Beyond 5975 Nifty it would be 'case 3'. We are very close to getting some very important clues as to what the Indian Nifty is going to do. USDINR - cross above 49.8 will be the first clue that USDINR will stretch to potentially 52 and as a consequence will indicate a corrective phase for Indian equities.

Sorry for the very short update - not fully recovered but will be able to respond to questions you might have on this chart.

 Posted by at 9:04 am
Feb 152012
 

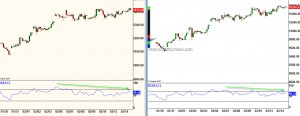
Nifty(5416): Markets despite being overbought, continues go up on receding momentum. The move from early February is like an automobile coasting  on residual inertia of motion even though the vehicle has run out of gas.

Nifty(Left) and Bank Nifty (right) - Daily Chart

While this is very unhealthy and the markets will sooner or later drop vertically once the residual inertia is over, prudent risk management and patience is an absolute must. The retracement will completely erase the last leg of this short-term move. That leg started at 5077 and that will be some sort of guaranteed level we are going to see once the correction sets in. We will watch for a big one day reversal pattern or 5325 for confirmation - do not know which will be the case.

Having said that this move is clearly a powerful wave in the short term. What does it mean in the higher time frame? Is it a sucker rally that is correcting the entire decline from Nov 10 to Dec 2011 as I'm assuming it to be? OR is it the beginning of something bigger? The answers for that will come through ONLY when the correction starts. Stay tuned.

Nifty support : 5325, 5210 and 5077. Resistance: 5440 and 5495

Open Position: Long Coal India @326-328 Tgt 360 Upgraded stop 320 at close

 Posted by at 8:44 am
Feb 132012
 

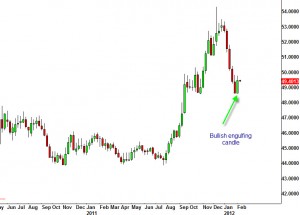
INR Weekly Chart

We have bullish engulfing candle on USD/INR weekly chart. If you want go long on USD place a stop below 48.5 and hold. IF USD/INR hits 52.2 it would prove beyond doubt that the decline from 54.5 was corrective and a new high way beyond 54.5 is coming. I'll be looking at the intraday price movements very closely in the coming days.

From a contrarian point - there are quite a few signals that are coming through for the US markets.

1) Larry Fink of Blackrock says Invesstors should be 100% in equities!!

2) Roubini's firm has turned bullish

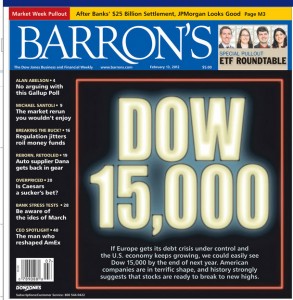
3) Barron's magazine has Dow 15k on its cover and says even 17k is a possibility!!

So either a decline of significance is about to start for US markets (i would prefer Dow 13k or S&P above 1370 and then a fall) or the decline may have already commenced on Friday.

 Posted by at 9:16 am
Feb 082012
 

Nifty(5335) - Resistance 5415 and Support 5300 and 5240

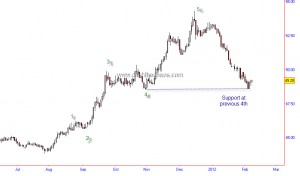
USDINR has found support at previous 4th wave of 48.5

INR daily charts

INR should weaken to 50.2-50.6 but we need further evidence from the movement here to signal that a bigger move is beginning for INR. There is a small possibility of one more leg  of strength for INR .

New position: Chambal Fert Short @ 86.5-87 Target of 77 stop 92

 Posted by at 9:04 am