admin

My name is Jai Bala and in this blog you will find my view on financial markets and trading from a chartist's perspective. Im a trader & market technician (MSTA, CFTe) and a very large part of my market knowledge was gained through trading for a living between 2002 and 2008. I have been investing in the markets since 1994, took up trading as a full time pursuit in 2002 and went on to manage portfolios of a few high-net individuals. Between Jul 2008- Jan 2010, I lead the technical strategy for the instituitional broking arm of Reliance Capital, advising hedge funds and other instituitional clients. I'll be covering the Indian markets mainly but will also touch upon other markets including the world indices, commodities, currencies and bonds. Within the Indian markets, my posts will focus on the Nifty index and the equities segment of the market. Through this blog I hope to keep in touch with my friends in the trading community. At the same time, writing and collecting my thoughts helps me stay disciplined and this blog is aimed towards that end.

Nifty still down YTD

 Uncategorized  Comments Off on Nifty still down YTD
Mar 172010
 

Though Nifty is on its sixth week of back-to-back gains, the benchmark is still marginally down on YTD basis if measured in local currency. The benchmark is up 2.35% if we take the base currency as USD or 4.35% if we take the base currency as Swiss Franc.

Interestingly, China is the worst performing index and Colombo's All Share Index is the best performing index in the Asian region.

 Posted by at 12:01 am

Transports at 52 week high

 Uncategorized  Comments Off on Transports at 52 week high
Mar 102010
 

After Russell 2000 and Nasdaq, the Dow Transportation Index has scaled a new 52 week high on improved volumes. Certainly a shot in the arm for the bulls.

 Posted by at 10:11 am

Dollar Index at an interesting juncture

 Uncategorized  Comments Off on Dollar Index at an interesting juncture
Mar 102010
 

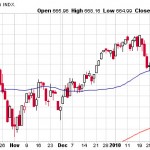
Dollar Index's (DXY) December-February rally had once again raised the spectre of deflation and had pinned down the equity markets. The recent rally off the Feb lows in equity markets is interesting, given the fact that the DXY has had a strong inverse correlation with equities since the Lehman collapse and it has hardly retraced off its highs. I had a closer look at the long term technicals and there were a few very interesting data points.

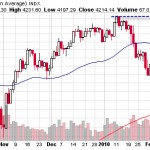
1) If we step back and have a look at the weekly charts over a ten year period the DXY is in an enormous structural bear market. Even a four year old would tell you that the trend is down (Yes, my son did say so).
2) Though the recent rally from 74 to 81 looks like a trend-shift, my preferred weekly wave count, seems to suggest that this could be just a corrective move (wave 4) and a weekly close below 79.7-79.65 could mark the start of next leg in the down trend.
3) The three-legged rise from 74 & change has not even been able to touch the 50% retracement point of the 2008-2009 decline. This is hardly a sign of strength.
4) On March 2nd, the Index failed to clear its Feb highs. A failure at resistance on the first anniversary of topping out often generates a powerful sell signal.

So the recent market action seems to suggest that either the Dollar Index is set for another leg of decline and hence there would be more money chasing all asset classes. Or the inverse correlation that existed between the Index and the Equity markets is coming to an end. Either way, it seems like a win-win situation for the bulls.

Mar 082010


While the Dow Industrials and S&P 500 are yet to take out their 52 week high's the small cap Russell 2000 has scaled above its 52 week high and is holding well above it. This shows that the risk appetite of investors is still alive and kicking. In yesterday's session, the Nasdaq composite too notched a close above its January peak.

Another Index Dow transports, often considered a very good measure of the US economy, is just short of its 52 week high. A new high here will be a shot in the arm for the Bulls.

Nifty on a new channel

 Uncategorized  Comments Off on Nifty on a new channel
Mar 082010
 
Nifty

Channelled move

After 4 successive weeks of gains, the 5th week has also started off on a winning note for the Nifty. Excepting 2008, whenever the broad markets have clocked 4 successive weeks of gains, my visual analysis of Nifty and Sensex tells me that markets are embarking on a powerful rally.

At the very least one can expect Nifty to scale the upper borders of the channel shown above in the charts, currently in the region of 5600.

Mar 072010
 

Hello all,

After the cooling off period, I'm about to start cracking on the markets. I shall start off on a slow pace updating what I see on the Nifty and then once I'm into my rhythm, I aim to cover more markets, trade ideas etc.

Good Trading to you all.

Cheers,
Jai

 Posted by at 11:26 am