It is always a good idea to start from a very significant market turn to get a clear picture of how a market is poised at its current juncture. Hence, we take a look at Bank Nifty from its 2009 low.
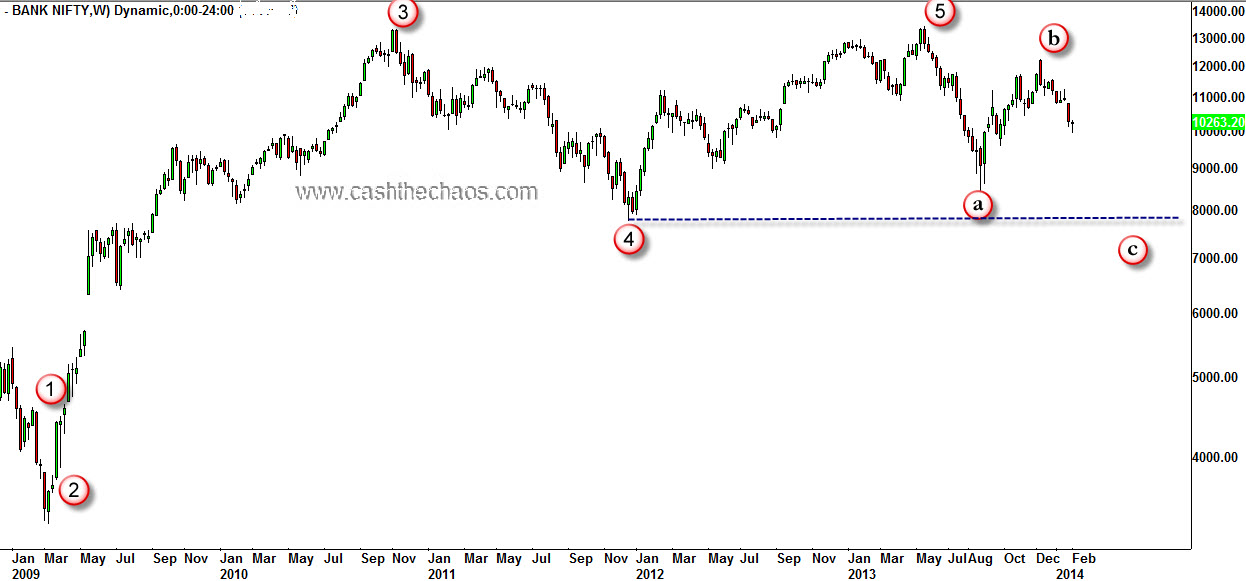
Bank Nifty - weekly charts with Elliott Wave Labels
After a close analysis of the weekly charts of Bank Nifty from an Elliott Wave perspective, we are able to label the move from the 2009 low to the 2013 high as a completed 5 wave move. The wave principle tells us that once a 5 wave move is complete, we should look for a 3 wave corrective move against previous trend. This 3 wave move is labeled as an a b c (in circle). Most often this entire corrective wave ends near the previous fourth wave. The blue dashed line on the chart is where the previous 4th wave started and this level corresponds to 7766, which is one possible ending point for this corrective move.
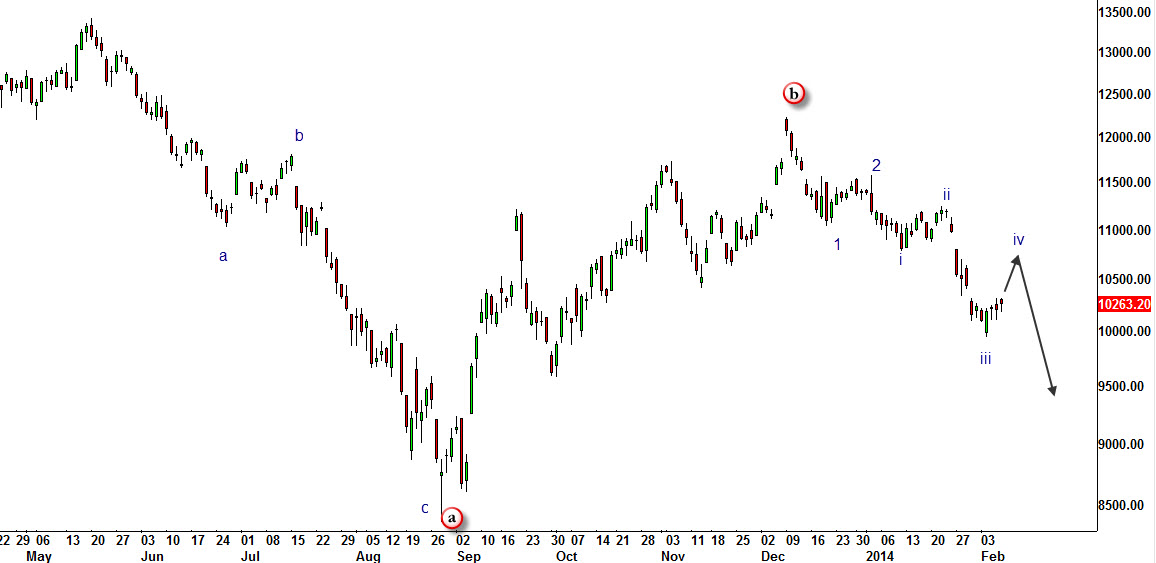
Bank Nifty Daily Charts with Elliott Wave labels
Now lets take a closer look at this corrective move. Drilling down to the daily charts, we are interpreting that at this juncture only Wave a and Wave b are complete and Wave c is underway. Since wave c's are normally a five wave structure, we are interpreting the current decline to be incomplete.
If so far everything has been Greek and Latin, do not worry. What we have to do with these interpretations and wave labels is right ahead. Using the guidelines and rules of wave principle, the key point for us is that, the bounce from 9961 (Feb 4th) on the Bank Nifty is unlikely to touch 10788 as wave iv cannot overlap into wave i and is very likely to end somewhere between (10453-10756).
So what do we do with this information? Once Bank Nifty enters this price zone of 10453-10756, we look to build short positions for the bigger target of 7766 (previous wave 4) or 7200 (where circled wave A would = circled wave C)(Ideally 1/3rd at 10456, 1/3rd at 10600 and 1/3rd at 10750). One can use 10788 itself as a stop but it would be safer to use 11040 as a stop - that is if you are a futures trader. If you are an options trader, one may look to build positions in March 9000 put or the March 9500 put when the Index starts enters zone of 10450-756.
Note: All levels mentioned here are Bank Nifty spot levels and not front month or next month futures levels.
PS: Make sure you save a copy of this report as this is a pay per view report.
Legal Disclaimer: This post gives an idea of how a trader chooses low risk entry points for trading and hence what you see in this post is for educational purpose only. This is no solicitation to buy, sell or hold any securities. I’m not a registered investment advisor and I strongly urge you to consult one if you are going to act on the above idea. If you decide to take action on the above idea, you are agreeing that you take full responsibility for the profit or loss that you may sustain based on such decisions and agreeing to indemnify the author of the same. You may have seen me on TV suggesting successful trade ideas but remember trading is inherently risky and past performance is no guarantee of future outcome.
PS: This was a premium content and has now been unlocked. Trade set up invalidated on a move above 11040.
3 Responses to “What lies ahead for Bank Nifty?”
Sorry, the comment form is closed at this time.
Hi Jai,
Found information that one can have a longer term relationship with you instead of a ‘pay per view’ basis.
Please provide additional details.
Thanks in advance
Dear Jai,
Thanks for your reco. Do I wait for the banknifty to rise or could I take a March exp. position at current rates.
Regards.
Narayan
Hi Jai,
Request you to mail me the options for longer term subscription to your views and not ala carte. I regard your views on markets very high.