Apr 272011
 

Silver's sharp decline after hitting a multi-decade high warrants close attention.

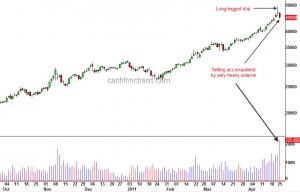
Silver- Daily Charts

The daily chart of silver above marks the "long-legged doji" which is a key warning of sign of an impending reversal. Moreover this pattern (a) has occurred after a prolonged and parabolic rise in silver (b) has seen follow through selling on very heavy volumes and (c) has faced resistance at the 1980 highs. These are mouth-watering signs for much lower prices for silver.

However I will probe this set up with a very small short trade - the Dollar Index has shown no signs of reversal and is merely consolidating near the lows. Unless the green-back turns up this might turn out to be just a fleeting drop in an up-trend.
Apr 132011
 

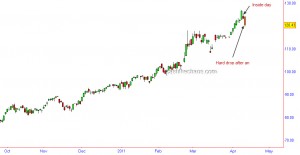
Brent Crude had formed an 'inside day' and it has now exceeded the range of this inside day, dropped hard to the downside. So, there is a high degree of probability that there is an intermediate term reversal in crude.

Brent - Daily Charts

Reversal in Crude?

 Commodities  Comments Off on Reversal in Crude?
Apr 122011
 

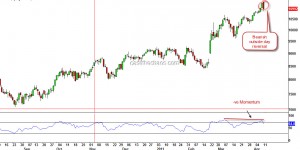
The daily charts of Nymex Crude registered a very important price action which could potentially mark a trend reversal. In technical parlance this is called a bearish outside day or a bearish engulfing candle.

Momentum readings have also diverged negatively with this occurrence and the number of contracts that accompanied this sell-off also ticked up (a nice to have). Now why should you pay attention to this? Besides the fact that the 2008 reversal was also a bearish outside day, I'm sure you would have heard and seen reports of $200+ crude over the last few weeks flying thick and fast. Essentially, it is a very crowded trade.

Now if crude does come down, do not be mislead into thinking that a falling crude may be the new impetus for stocks. If this is indeed a reversal for Crude, stocks are also likely to start a new downtrend or resume the previous down draft depending on which markets you are focussing on. Here is an interesting snippet regarding crude from one of my past interviews:

httpv://www.youtube.com/watch?v=hJuWU1GEYD0

As a reality check, let me also add that I do not see such a reversal in Brent Crude. It would have been another nice to have and would have added more weight to the reversal.

Apr 102011
 

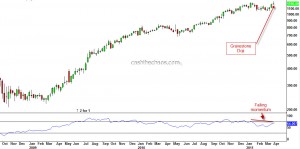
Last week, TCS hit new life time high on Tuesday but by the end of the week the stock closed under the previous high of 1220. The chart below is the weekly chart of TCS showing a 'gravestone doji'  formation suggesting supply is starting to over-power demand. The bottom panel also shows momentum diverging negatively with the price movement.

TCS - Weekly Chart

Drilling down to it's daily chart, it is quite clear that when TCS clocked new highs, there was not any significant volume expansion. The stock was not able to sustain above it's previous high of 1220 for more than a day and has continued to move lower. This price action is looking more like a head-fake rather than a true breakout. Now, if you are a conservative trader, you can wait for the breach of 1125 to book out longs and reverse direction. An aggressive approach would be to turn bearish below last week's low of 1184 with a stop placement above 1220 or 1247.

 Posted by at 4:52 pm  Tagged with: