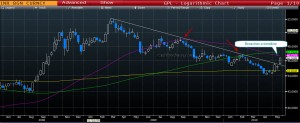
Today's price action in the Indian currency has put a question mark on the bullish price objective of 41.5-42.0 that we have been maintaining since last year. In today's trading, the USDINR closed above an intermediate term trend-line (see chart) that had kept the rupee's strength going.
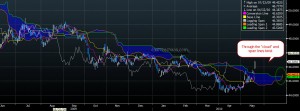
Looking at the Ichimoku charts, the currency has overcome the "cloud" resistance on its daily charts. Also, a span twist is visible (green circle) which is another bullish sign for the USDINR (bearish for the rupee). All these price actions have transpired on the day when the Indian Nifty has closed below its 200 DMA for the first time since April 2009 - a sign that FII's may be heading for the door. Considering the above technical evidence, we expect Rupee to test the support of 47.6-47.8 in the short to medium term.
The longer term Elliot Wave count for the INR seems to suggest that what we saw from 52.18-44.05 may have been just a wave 4 and the current move could be the start of a wave 5 that could go on to test the level of 52. Although this is too early, we will keep this at the back of our minds.


Sorry, the comment form is closed at this time.