Nifty(5269): Nifty formed a 'Doji' pattern after overshooting the important resistance at 5275. We have momentum disagreeing with price rise above 5217 on hourly and daily time frame. This is normally a precursor to a drop.

Nifty - Weekly charts
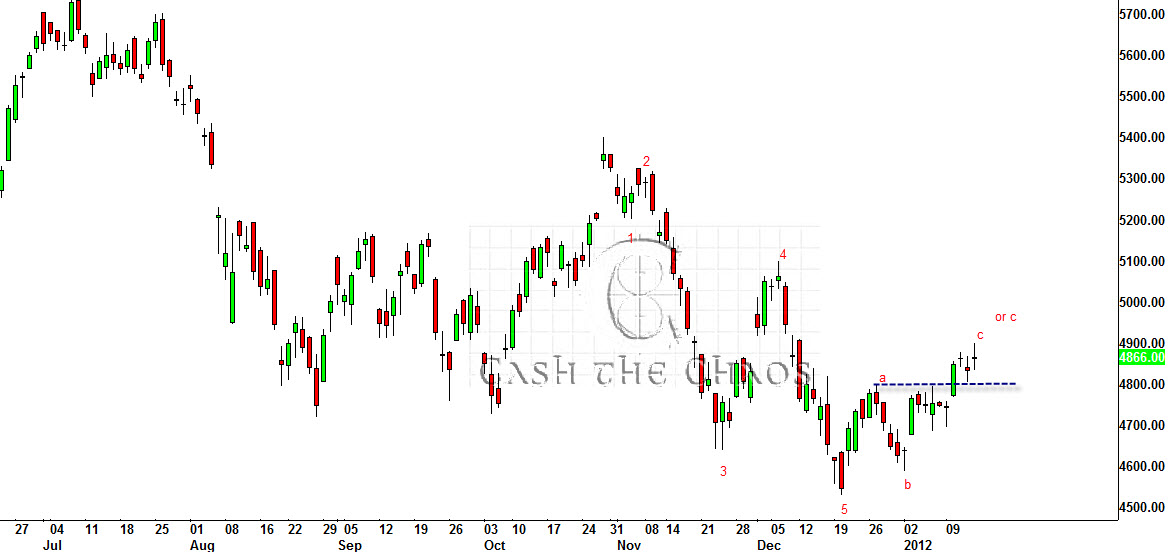
On the weekly time frame, Nifty is above the weekly trendline from the Nov 2011 highs. A close above this level today would tell us that we are not in the same environment that we were in since Nov 2011. Alternately, a strong rejection from here would mean some bearishness.
Likewise for many important inter-related markets like the Dollar Index, Gold and S&P 500 the markets are poised at a critical time and price window.
Gold - 1765 is a 61.8% Fibonacci retracement level. As I write this, it is coming off slightly from the overnight high of 1761. Euro - the zone of 1.32 to 1.35 is important and the 17 nation currency has got rejected twice off this level. The US S&P - VIX is at a dangerously low level, momentum indicators are warning off lack of fire power.
Time: Feb 6th/8th happens to be an important time window for a short term peak ATLEAST for equities.
The bottom line is the risks of being long here is very high - if you are long be nimble.
Nifty support and Resistances: A drop below SUPPORT of 5225 would mean the first signs of corrective decline to the move from 4530 to 5291. We have to evaluate if it might mean something bigger. A bare minimum correction of 4950 should come through.
In the event Nifty continues to head higher, RESISTANCE is at 5345.


