Jai

Feb 232012
 

Nifty(5505):

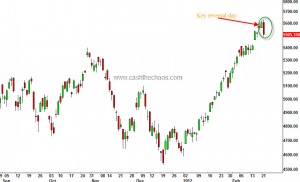
Nifty Daily chart

Indian benchmark indices saw a key reversal day on the indices (see chart above).  A new swing high followed by a strong rejection of the new high. This is usually very bearish but momentum points to an unfinished move.  So, we will prefer a corrective decline followed by a another leg up.

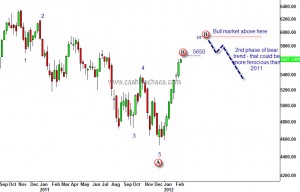
BUT, if we see a "FIVE" along with this correction, we may have to conclude differently. As shown in yesterday's chart, the bigger B wave can end either at 5650 or slightly below OR closer to 5975. Yesterday's high was very close to 5650. Keep tabs on USDINR - if it crosses 49.8 that would the first warning sign for Bulls that things may not be smooth for them.

Supports: 5480, 5325 and 5077 (so watch for correction to get some support here - I prefer a decline 5325 to 5077)

Resistance: 5650

 Posted by at 9:00 am
Feb 222012
 

Nifty(5607):

Nifty weekly charts

The above chart is the 'case 2' we had outlined several days back in this month's morning note. Beyond 5975 Nifty it would be 'case 3'. We are very close to getting some very important clues as to what the Indian Nifty is going to do. USDINR - cross above 49.8 will be the first clue that USDINR will stretch to potentially 52 and as a consequence will indicate a corrective phase for Indian equities.

Sorry for the very short update - not fully recovered but will be able to respond to questions you might have on this chart.

 Posted by at 9:04 am

Gold, the Buffett slayer

 Uncategorized  Comments Off on Gold, the Buffett slayer
Feb 172012
 

A recent business insider article calls 'Gold bugs' thin skinned misanthropes because Warren Buffett "..devotes a few paragraphs to gold and the fools who worship it" in his upcoming annual letter!!   Regular followers of this blog know that I had turned cautious on Gold around $1700's and bearish in September 2011 - just establishing I'm no gold bug.

In my May 2010 post, I had highlighted how such fancy theories can be quite flawed and prevent you from arriving at the best investment decisions. Now to Mr Buffett's renewed Vitiriol against gold:

1) The cube of gold will produce nothing in the next hundred years

My answer: No one makes investment decision for next hundred years

2) The cube of gold will not pay you interest or dividends, and it won't grow earnings.

My answer: So will be the case with a boat load of stocks. The S&P has gone no where in the last 13 years.

3) You can fondle the cube of gold, but it won't respond.

My answer: Yes, witty.   Hence I'll try to be funny too.   Mr Buffett should know what to fondle.   If you own lots of gold you do not need to fondle, 'they' will fondle you 😀

The reason for Mr Buffett's bashing?   Well, whatever I say would purely be a guess but I would let the performance of Gold speak for itself:

Gold's return for the last 10yrs - 488.19%

BRK's return for the last 10 yrs - 67.77%

Gold continues to wallop the performance of  Berkshire Hathway by a GIGANTIC 420% over his preferred time frame of 10 years.

And if you had listened to Mr Buffett's  Annual letter of last year, you are in the elite company of those who missed the best performing asset class of 2011 - long dated bonds that returned almost 30%.

Here are the words of another  billionaire who is in the same business. "At the end of the day, your job is to buy what goes up and to sell what goes down. So really who gives a damn about PE's?" – Paul Tudor Jones
Feb 152012
 

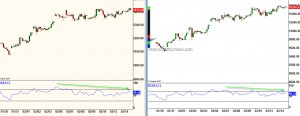
Nifty(5416): Markets despite being overbought, continues go up on receding momentum. The move from early February is like an automobile coasting  on residual inertia of motion even though the vehicle has run out of gas.

Nifty(Left) and Bank Nifty (right) - Daily Chart

While this is very unhealthy and the markets will sooner or later drop vertically once the residual inertia is over, prudent risk management and patience is an absolute must. The retracement will completely erase the last leg of this short-term move. That leg started at 5077 and that will be some sort of guaranteed level we are going to see once the correction sets in. We will watch for a big one day reversal pattern or 5325 for confirmation - do not know which will be the case.

Having said that this move is clearly a powerful wave in the short term. What does it mean in the higher time frame? Is it a sucker rally that is correcting the entire decline from Nov 10 to Dec 2011 as I'm assuming it to be? OR is it the beginning of something bigger? The answers for that will come through ONLY when the correction starts. Stay tuned.

Nifty support : 5325, 5210 and 5077. Resistance: 5440 and 5495

Open Position: Long Coal India @326-328 Tgt 360 Upgraded stop 320 at close

 Posted by at 8:44 am
Feb 132012
 

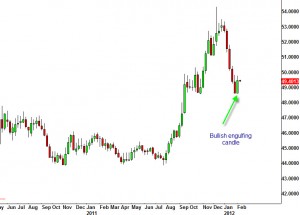
INR Weekly Chart

We have bullish engulfing candle on USD/INR weekly chart. If you want go long on USD place a stop below 48.5 and hold. IF USD/INR hits 52.2 it would prove beyond doubt that the decline from 54.5 was corrective and a new high way beyond 54.5 is coming. I'll be looking at the intraday price movements very closely in the coming days.

From a contrarian point - there are quite a few signals that are coming through for the US markets.

1) Larry Fink of Blackrock says Invesstors should be 100% in equities!!

2) Roubini's firm has turned bullish

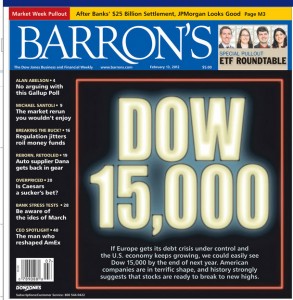
3) Barron's magazine has Dow 15k on its cover and says even 17k is a possibility!!

So either a decline of significance is about to start for US markets (i would prefer Dow 13k or S&P above 1370 and then a fall) or the decline may have already commenced on Friday.

 Posted by at 9:16 am
Feb 082012
 

Nifty(5335) - Resistance 5415 and Support 5300 and 5240

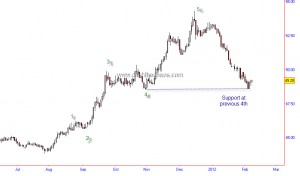
USDINR has found support at previous 4th wave of 48.5

INR daily charts

INR should weaken to 50.2-50.6 but we need further evidence from the movement here to signal that a bigger move is beginning for INR. There is a small possibility of one more leg  of strength for INR .

New position: Chambal Fert Short @ 86.5-87 Target of 77 stop 92

 Posted by at 9:04 am
Feb 072012
 

Nifty(5361): Price is ignoring the stretch and the warning signs from momentum indicators and we are seeing Nifty movin up relentlessly. More than anything we need to look at the longer term now. Let me outline 3 possible scenario

Case1: A new bull market is underway:

In that case Nifty is headed north of 7000

The problem with this technical structure is this - the bottom at 4530 has been an atypical one. The speed of the move though is in favour. This is our Outlier case.

Case 2: An uptrend for the next 6 weeks and then a drop equal in amplitude to the drop from Nov 10 to Dec 11 resumes.

Nifty is headed for 5650 or 5950 with some pull back if this scenario is going to unfold.

Case 3: The bear case

Nifty ends its rise today or max tomorrow and targets a break of 4530.

I will expand on this with charts and labeling when I get more inputs from Commodities, Currencies and other inter-related markets.

My base case is SCENARIO 2.

 Posted by at 8:43 am
Feb 032012
 

Nifty(5269): Nifty formed a 'Doji' pattern after overshooting the important resistance at 5275. We have momentum disagreeing with price rise above 5217 on hourly and daily time frame. This is normally a precursor to a drop.

Nifty - Weekly charts

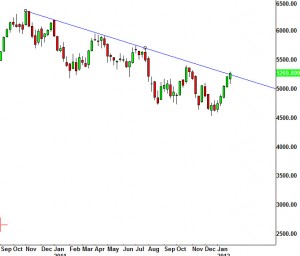
On the weekly time frame, Nifty is above the weekly trendline from the Nov 2011 highs. A close above this level today would tell us that we are not in the same environment that we were in since Nov 2011. Alternately, a strong rejection from here would mean some bearishness.

Likewise for many important inter-related markets like the Dollar Index, Gold and S&P 500 the markets are poised at a critical time and price window.

Gold - 1765 is a 61.8% Fibonacci retracement level. As I write this, it is coming off slightly from the overnight high of 1761. Euro - the zone of 1.32 to 1.35 is important and the 17 nation currency has got rejected twice off this level. The US S&P - VIX is at a dangerously low level, momentum indicators are warning off lack of fire power.

Time: Feb 6th/8th happens to be an important time window for a short term peak ATLEAST for equities.

The bottom line is the risks of being long here is very high - if you are long be nimble.

Nifty support and Resistances: A drop below SUPPORT of 5225 would mean the first signs of  corrective decline to the move from 4530 to 5291. We have to evaluate if it might mean something bigger. A bare minimum correction of 4950 should come through.

In the event Nifty continues to head higher, RESISTANCE is at 5345.

 Posted by at 8:59 am

Baltic Dry Index breaks 2008 low

 Commodities, World Markets  Comments Off on Baltic Dry Index breaks 2008 low
Feb 022012
 

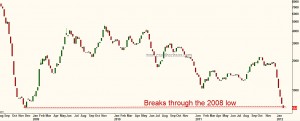
The Baltic Dry Index has been dropping continuously for the last 31 sessions. The index just broke through the 2008 low and this is worst reading on this index for the last two and a half decades.

Baltic Dry Index

If you are wondering why should this be of any significance - the index is a very important measure of the health of global economy. You could either believe the commentators who are saying that we are seeing rally in equity markets because Europe is "close to being solved" (when Maths 101 tells us its impossible) or pay attention to the warning signal from this index and stay cautious and try to be safe.

Jan 312012
 

Nifty(5087.3): Markets had a follow through to the hanging man pattern - throwing in a short term sell signal. However the internals of the move still remains a bit ambivalent giving an outside chance of one more rise before turning lower. If  Nifty heads higher it may either stop at 5217 or below or head slightly higher.

Two important points from yesterday. One, as pointed out only now Portugal is getting media coverage. Second, the A is to C ratio that we discussed yesterday(see yesterday's chart) needs a small explanation. If that ratio is about to play out, I will not be surprised if Nifty heads to even as low as 3900. Unfortuantely, this will be an Iron-clad confirmation only when Nifty hits 4800. Until that one has keep positions small.

So how do play the current set up? Play it through puts-  Long 4800 put around 23-26 and forget it (Fixed risk). If you are aggressive - write 5200,5300 calls and if Nifty crosses 5225 fold the trade.(The premium could double if the set up is wrong).

Support: 5065 and 4990

Resistance: 5170 and 5225

 Posted by at 8:07 am