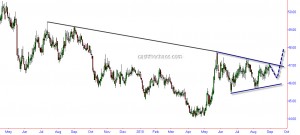
As mentioned in my August 27th post, the Indian Rupee has hit the upper borders of the trendline and looking at today's SGX Nifty at pre-open and early currency market moves, it may be moving along expected path. This is shown in the chart below:

USDINR Daily Chart
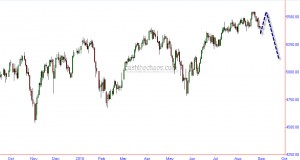
So if USDINR charts this path, the stock markets should take an inverse path - that either stalls under highs of August or makes a high slightly above 5600 and pulls lower sharply when INR breaks out of the symmetrical triangle. The chart below shows this scenario on Nifty.

Nifty Daily Charts


