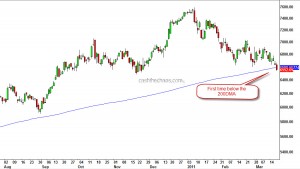
If you thought the key price action of last week's trading activity in the Indian bourses was Reliance's drop on Friday, that is not entirely true. The CNX IT index's steady price erosion over the last week is actually more important.
All through the corrective declines since the March 09 bottom, not once did this index drop below the 200 DMA. Yet another, sign that this is not a mere correction.
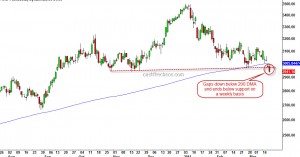
Infosys, the technology heavy weight has an interesting price chart.
The stock gapped below its 200 day moving average on Thursday and ended the week firmly below this level.
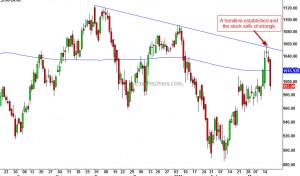
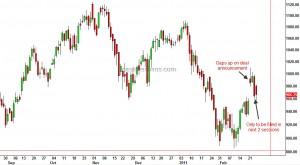
Reliance the stock on which the hope's of the bulls are pinned, established a firm downward sloping trendline and the stock has started to drop strongly.
While the talk of the week was the apparent resilience of the Indian market during a crisis , it was actually the bears who were scoring. This is the first time since 2008 that all the sectoral indices are trading below their respective 200 DMA!!


