Feb 072012
 

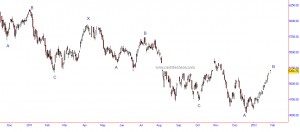
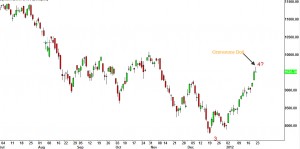
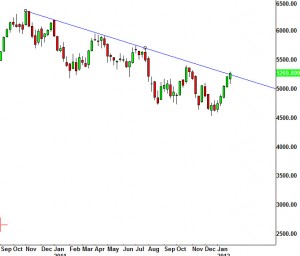
Nifty(5361): Price is ignoring the stretch and the warning signs from momentum indicators and we are seeing Nifty movin up relentlessly. More than anything we need to look at the longer term now. Let me outline 3 possible scenario

Case1: A new bull market is underway:

In that case Nifty is headed north of 7000

The problem with this technical structure is this - the bottom at 4530 has been an atypical one. The speed of the move though is in favour. This is our Outlier case.

Case 2: An uptrend for the next 6 weeks and then a drop equal in amplitude to the drop from Nov 10 to Dec 11 resumes.

Nifty is headed for 5650 or 5950 with some pull back if this scenario is going to unfold.

Case 3: The bear case

Nifty ends its rise today or max tomorrow and targets a break of 4530.

I will expand on this with charts and labeling when I get more inputs from Commodities, Currencies and other inter-related markets.

My base case is SCENARIO 2.
 Posted by at 8:43 am
Feb 032012
 

Nifty(5269): Nifty formed a 'Doji' pattern after overshooting the important resistance at 5275. We have momentum disagreeing with price rise above 5217 on hourly and daily time frame. This is normally a precursor to a drop.

Nifty - Weekly charts

On the weekly time frame, Nifty is above the weekly trendline from the Nov 2011 highs. A close above this level today would tell us that we are not in the same environment that we were in since Nov 2011. Alternately, a strong rejection from here would mean some bearishness.

Likewise for many important inter-related markets like the Dollar Index, Gold and S&P 500 the markets are poised at a critical time and price window.

Gold - 1765 is a 61.8% Fibonacci retracement level. As I write this, it is coming off slightly from the overnight high of 1761. Euro - the zone of 1.32 to 1.35 is important and the 17 nation currency has got rejected twice off this level. The US S&P - VIX is at a dangerously low level, momentum indicators are warning off lack of fire power.

Time: Feb 6th/8th happens to be an important time window for a short term peak ATLEAST for equities.

The bottom line is the risks of being long here is very high - if you are long be nimble.

Nifty support and Resistances: A drop below SUPPORT of 5225 would mean the first signs of  corrective decline to the move from 4530 to 5291. We have to evaluate if it might mean something bigger. A bare minimum correction of 4950 should come through.

In the event Nifty continues to head higher, RESISTANCE is at 5345.

 Posted by at 8:59 am
Jan 312012
 

Nifty(5087.3): Markets had a follow through to the hanging man pattern - throwing in a short term sell signal. However the internals of the move still remains a bit ambivalent giving an outside chance of one more rise before turning lower. If  Nifty heads higher it may either stop at 5217 or below or head slightly higher.

Two important points from yesterday. One, as pointed out only now Portugal is getting media coverage. Second, the A is to C ratio that we discussed yesterday(see yesterday's chart) needs a small explanation. If that ratio is about to play out, I will not be surprised if Nifty heads to even as low as 3900. Unfortuantely, this will be an Iron-clad confirmation only when Nifty hits 4800. Until that one has keep positions small.

So how do play the current set up? Play it through puts-  Long 4800 put around 23-26 and forget it (Fixed risk). If you are aggressive - write 5200,5300 calls and if Nifty crosses 5225 fold the trade.(The premium could double if the set up is wrong).

Support: 5065 and 4990

Resistance: 5170 and 5225

 Posted by at 8:07 am
Jan 302012
 

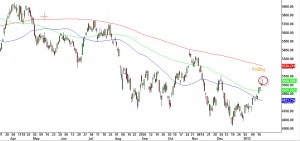
Nifty(5204): Nifty formed a hanging man pattern on Friday, just under the 200DMA. Hanging man pattern needs a follow through sell off else the signal would be rendered void. The first sign that this market starting to correct would be when Nifty dips below 5162.

The Euro has come to perfect level for it to end the counter-trend rally and begin a decline. AND we have an European summit today! Seems like a perfect setup.

The environment seems to start looking like October 2011 when the equity markets were ignoring what the bond markets were saying. Portugal has gone over the cliff  and equity markets are not even taking note of it - watch out Portugal will very soon be making headlines and "surprise" everyone.

On Nifty, in Elliot wave terms, even if we see this market as a Triple Zig Zag - the current decline seems to be incomplete.

Nifty Daily Charts

The interesting thing with this interpretation is that in each of the ABC patter. C wave is almost perfectly 1.618 times A. So if we have an overlap at 4800 on the Nifty when this pullback comes through the target for it could be much lower than 4530. But that is a topic for another day.

Nifty supports: 5162, 5127 and 5040. Resistance 5225, 5275.

 Posted by at 8:55 am
Jan 252012
 

Nifty(5127): The negative price action of Monday did not get the follow through and markets continued to rally higher.

Vix and Nifty

As can be seen from the chart of India VIX above, the bullish sentiment is swinging towards the highest level since October 2011 and if we include the spike, it has already hit highest level since the Nifty peak of July 2011. So if and when you go long stay in the cash market, do not leverage.

This need not mean that participants will realise their excess and start paring down the longs right from today. From Nifty's price action market seems to be taking aim at the 200 DMA and the trendline from the Nov 2010 top.

So the next zone resistance for Nifty is at 5225-5275.  Support 4995 and 4940. The first sign of weakness would be when Nifty drops below 4940.

 Posted by at 7:06 am
Jan 242012
 

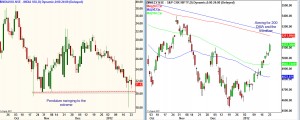
Nifty(5046): The market is pausing around the resistance of 5065-70 ahead of economic policy. An important signal is coming from the Banknifty - a "gravestone doji" on this index right at the ideal zone of 9500-9800.

Bank Nifty - Daily Charts

Gravestone Doji are important signals but they need an immediate follow through. We need to see a sell off in Banknifty today too. If it comes through this rally is over.

Indiavix too saw a spike down to 18 day before yesterday. The spike was the lowest level since July of 2011. So there is a good possibility that we have seen complacency extreme for the short-term.

Nifty Resistance: 5065-70, 5100 and 5135. Nifty support: 4980.

 Posted by at 8:50 am
Jan 232012
 

Nifty (5048): Nifty's high on Friday was exactly one point below the resistance of 5065. The pattern on the daily chart is a stalling pattern.

Nifty - Daily Chart

Without getting in to the short term technical labeling of the market, there are two possibilities:

a) The corrective rally has already peaked

b) Or after a mild dip, the sucker rally continues to head higher and traps a huge number of bulls

Once again the key for this going to be 4800 - that is the line in sand for the bull-bear divide on the Nifty. If I see any other early sign that the corrective rally has ended, I will post or send an intra-market update.

Resistance: 5065: Support: 4910

 Posted by at 8:53 am
Jan 202012
 

Nifty(5018): Nifty continued to rally and closed above 5000. Round numbers are not resistances but they help in pushing sentiment to the extremes.

Let's quickly do a check on the positives and negatives.

Whats favouring the bearish case?

1) Our proprietary which has a stellar record since 1997 says the bear market is not over.

2) The rise still looks corrective rise - a three not a five in Elliot wave terms

3) Sentiment on Nifty and INR are getting very one-sided and excessively bullish ( I'm hearing calls for 5600 Nifty and 2008 highs for for ADAG)

4) IT stocks may have rolled over the bearish side

What's favouring the bulls?

1) The breadth so far has been encouraging.

2) Markets have been penetrating through big resistances

3) Reliance trying to offset the negatives through a buy back

So here we are with Nifty making a dash at the December highs. It is very likely that if market is going to reverse it is going to do it either today with a pop at open or on Monday.

Nifty Resistance : 5065-5075 Support 4960. Watch for the first 15mins, note the highs and lows at 9:30IST. If market drops below the low, high chances that markets have seen an exhaustion. Try a VERY SMALL short with stop at above 5100 or the high of the first mins IF AND ONLY if Nifty drops below the low you have noted.

 Posted by at 2:30 am
Jan 182012
 

Nifty(4967): Nifty had another up day and pierced through resistance at 4920-50 zone. As labelled on Monday, there was some doubts over the end of the C wave , which is why we had an OR c label and this exactly why we called for some additional patience yesterday. As the market goes higher, it pushes the sentiment one sided and emboldens the late buyers. The next resistance for Nifty is at 5022 and Nifty is still maintaining the bearish configuration of 5 down 3 up mentioned on Monday (click here).

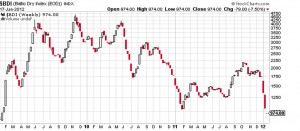
The important development over the last two-three weeks - probably very few have taken note or even aware is the baltic dry index.

Baltic dry index - weekly chart

The index has dropped precipitously over the last fortnight, shaving off a nasty 50%. This does not augur well for the world economy. There might be delay in equity markets reaction but it will react soon as this often tends to lead equity market moves.

So as far Nifty is concerned the conservative trade is to wait for overlap at 4800 or an one day reversal that tells that overlap of 4800 is coming. Patience is a virtue and it will reward handsomely - sit on your hands. If you can't keep your thumbs down, go for an out of the money put in small quantity but remember you would be preempting the market if you did that.

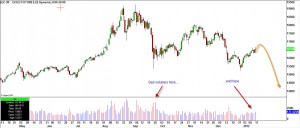
Some of you  are curious about gold - NO it has not formed a double bottom.... yet. It is a double bottom IF AND ONLY IF it goes above 1805.

Gold - Daily charts

As can be seen from the chart above Gold is rising with much lower volumes. This is not a bullish sign. After a small bump Gold is set to resume lower. Ill keep it very simple without getting technical. Dollar Index is unlikely to drop below 79.5 and head to 85 by Feb March. Can gold suddenly decouple from Dollar and move up with Dollar? It can but extremely unlikely. The same holds for silver. QED

 Posted by at 3:21 am
Jan 172012
 

Nifty(4873): Not much changed from yesterday's price action. The same conditions prevail. Either Nifty's corrective rally is ending or there is little bit of steam left (see yesterday's chart).

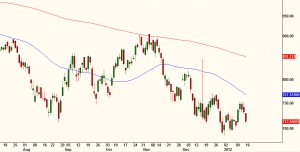
Reliance Daily Chart

The above chart is that of Reliance - the stock is hovering near its 52 week low and has not even been able to mount a corrective rally to its 50 DMA.

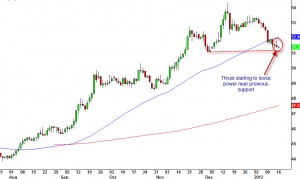
INR daily charts

Also the Indian rupee is starting to loose strength. On the chart above, the red line is an important support for the Dollar. The candles here are starting grow smaller and signals loss in fire power for further strength for the Indian rupee. A reversal bar here will be an ideal entry for Long Dollar against the rupee.

Be patient, the market will present a juicy shorting opportunity.

Support for Nifty: 4800 Resistance 4920-4950.

 Posted by at 3:21 am