Dr Reddy's seems to have completed an A-B-C correction and looks set for a new 52 week high. The elliott wave labels are shown on the chart below.
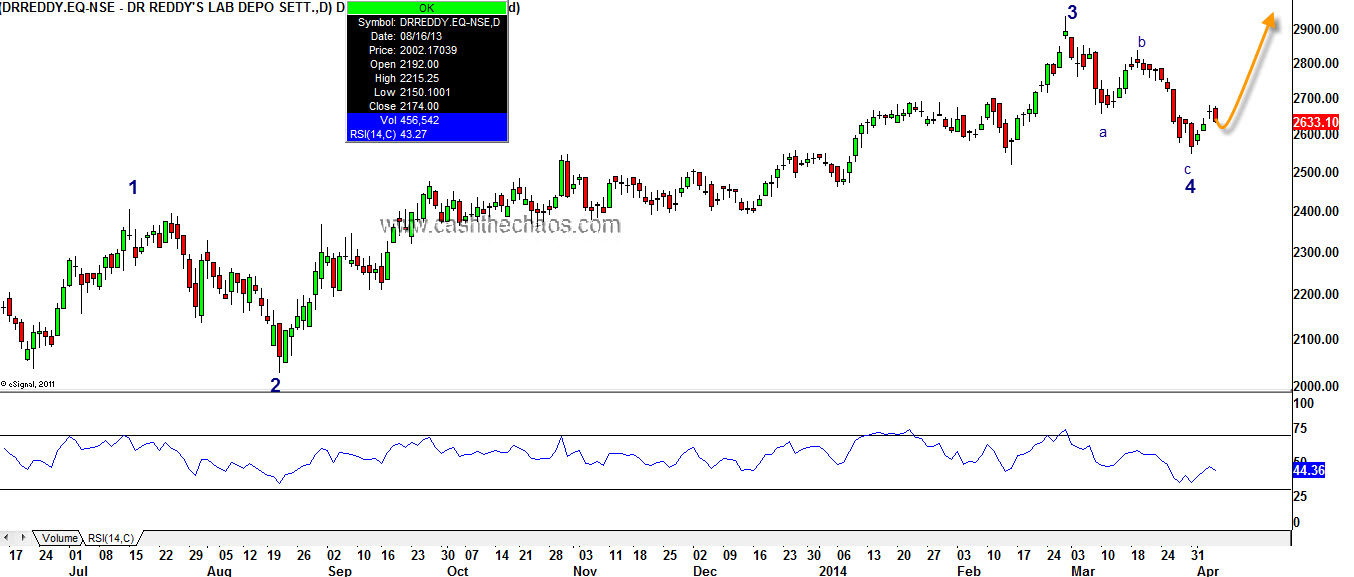
Dr Reddy Daily Charts with Elliott Wave Labels
If you connect the lows from Feb 2013, there is a trendline running through the recent low of 2540. Hence, it makes sense to go long at current levels of 2633 with a daily closing stop below 2540 and expect the stock to scale 2905-3000.
Please bear in mind that in the longer term time frame, we are in the fifth wave. Hence, one should not get aggressive on the long side. Also fifth waves tend to be slower than 3rd wave - something options traders need to be mindful (you may not want time decay eroding your premium despite being right).
Note: If you are a pay-per-view customer, remember to save this post as pdf.
Legal Disclaimer: This post gives an idea of how a trader chooses low risk entry points for trading and hence what you see in this post is for educational purpose only. This is no solicitation to buy, sell or hold any securities. I’m not a registered investment advisor and I strongly urge you to consult one if you are going to act on the above idea. If you decide to take action on the above idea, you are agreeing that you take full responsibility for the profit or loss that you may sustain based on such decisions and agreeing to indemnify the author of the same. You may have seen me on TV suggesting successful trade ideas but remember trading is inherently risky and past performance is no guarantee of future outcome.
NOTE: This was a premium content and has been unlocked now. The trade got stopped out at 2520 on 14th May after reaching 2780 on 30th April.
Sorry, the comment form is closed at this time.