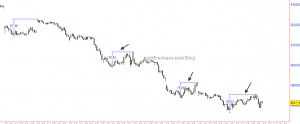
Nifty(4812.35): Looking at pullback since 5325, they have been extremely short-lived and less than 90 points, pointing to a very strong supply.
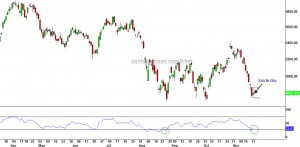
On the daily charts we have an "inside day" pattern, pointing to some indecision in the short term trend. Crossing the borders of the inside day resolves the indecision and often provides a directional move.
Given the fact that the drop from 5325 has been almost one-way, it is a bit doubtful that markets have enough energy to break the major support at 4720. BUT there is still a window of possibility. So, if we see Nifty breach 4765 there is a shorting opportunity with a stop above 4855 for a new low below 4720. If you want to be aggressive, it is below 4782. Likewise, on the higher side if Nifty breaches 4855, a long trade potential exists for atleast 4920. This is a discretionary trade set-up, will alert by sms if there are any stock specific trades.
As mentioned before, supports below 4720 are at 4650 and 4530.
9 Responses to “Technicals 23rd Nov 2011”
Sorry, the comment form is closed at this time.


SGX futures are showing a 50+ point gap down. Options data to me is suggesting that expiry will be between 4700 and 4800. I think a strong rally for a few days after expiry but not before.
Jai,
HDFC bank is beginning to slip.do u see anything in the relative better doing stocks ? Others like Hero Honda and Titan
Regards
Jai – Is silver good for another short – now that it has retraced to 32.90 which happens to be 38.2% of 44.21 – 26.04 ?
-Shiva
Hi Shiva,
I think already said that to some1 else’s comment. Its now 3% lower from there. Couple of times it has paused at 30.5. Watch that level closely now. Once that goes it will drop straight to 28-26.
hi jai,
i was able to scrape thru with onmobile @ 62.00 but the loss booked on the counter was about 5000.00, any advice on going short at upper level to recover loss or just forget about this trade
regards
There are always opportunities. Market will present them.
jai
i have been following this counter since quite some time jindal steel & power, it swings a lot in given time frame from 440 to 585 again back to 490, since i am not a technical person i have not been able to get it favorably, can you read the charts and generate calls for everybody to trade, or is it too much operator driven to trade in the same, your views on the same please
regards
400-375 is the potential here. Just need a little more information if price goes abv 600 one more time. Will get that during the next pullback. Will update soon.
Cheers,
Jai
Jai
Any views on Hindalco… i had it on my watch from last week but couldnt act on it today…Can we go long here. The stock has already risen by 10% today….
Also any banking stock which you might have on ur list for a quick trade on the long side.. i am long Icici @719 and Axis @ 962. What can be the targets for these..
Regds
Prateek sinha