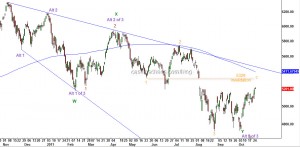
Nifty(5201.80): A break of the 8 week range of 4720-5160 came through on Tuesday - a breakout above the triangle that was highlighted on Tuesday. There is good news and bad news. The bad news for us is that this a breakout but the good news is that triangles more often occur at the penultimate leg of a move. While the validity of the Elliott wave count I have been maintaining since January is yet to get invalidated but looking at the market action in Europe and US, it does look like we will see a breach of 5329 on the Nifty and invalidate my preferred count.
The chart above outlines three possibilities, arranged in the order, least probable to the most probable:
1) Nifty does not violate 5329 and we maintain our preferred path
2) The bulls are back and markets are headed for a new all time high
3) Short-term rally continues to somewhere in the region 5400-5600 and a reversal comes through post that
The first scenario is straight forward - market is going to tell us right at the open. The other two scenario's we will reason out the why's and the why not's. On the charts this scenario is labelled using the Red and Orange numbers.
Scenario 2: The bulls are back and this is shown on the charts above by W, X, Y marked in green. There are numerous problems here:
(a) This scenario essentially means that the bear market has completely spared index heavy weights like Hero Honda, M&M, ITC and Cement majors. I have never seen a bear market end with index components at or near 52 week highs.
(b) The 2008-2009 bear market ended with a double zig-zag pattern and the above labelling also calls for a double zig-zag. Markets rarely ever repeat in the exact manner and that too in the immediate cycle.
(c) At the bottom of a bear-market, markets do not trade at 18 times trailing earnings, it trades somewhere in the region of 10-12 times trailing earnings or even lower. When markets open tomorrow it will trading closer to 19 times trailing earnings - these levels are closer to a top rather than a bottom.
Scenario 3: This scenario is labelled with Alt 1, Alt2 in purple colour. This scenario is just a variation of my existing wave count. Only the internals are different. Exactly for the above reasons outlined in Scenario 2, this is the most likely outcome. The INR is an important part of the equation here - the structure for the currency is such that we have only seen a partial portion of the currency weakness. Sharp rallies like we saw in Europe and US overnight serve 2 purposes - it cleans out the weak hands and helps in pushing the sentiment to extremes. However, patience is the key. We do not want to be too early on the short side.
We will also try to capitalise on the short term energy and pull some swing trades. The aim would be to not linger too much on the long side.
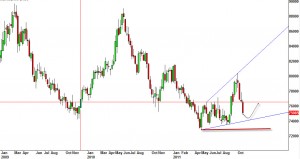
Dollar Index: The rally since the October low has been on weak dollar. There are quite a few possibilities for the dollar out here but the bottom line if the Dollar Index starts to reverse, RIP for the stock market rally. However, if the powers that be manage to push the dollar index below the red line shown, which I think is a low possibility, be prepared for a currency crisis or an inflationary holocaust.
US stock markets: One sentiment measure I follow is now higher than it was when stocks where 6.5% higher in May 2011. This set up is normally associated with a market peak - it could be secondary or primary. Watch out as the market unravels.
10 Responses to “Technicals – The big picture”
Sorry, the comment form is closed at this time.


Jai,
Fair enough. Time to look ahead and figure out where we could possibly make money.
Regards
USDINR overnight drop…support expected at?
74.55 is a big support
Dear Jai,
I basically have subscribed to your premium service to understand EW and its various interpretations.
I just know the basics.Can you please list some books which can be a good read for Advanced EW Analysis..or some book which has it all and can be regarded as wholesome?
Regards,
Rahul T
Dear Rahul,
Bob Prechter and AJ Frost is the bible. After that, you need to apply on markets in real time and stick to your counts until proven wrong – that is the best way. It wont be after the fact.
Feel free to email me with your counts when in doubt.
Cheers,
Jai
Hi Jai,
Sometime back, u had mentioned that 1740 might be a good time to go short on Gold. Have u noticed anything different ?
Thanks for your help.
Regards
1740 to 1790 is the zone. No Change
hi jai,
i have taken a small risk, i have shorted one lot wipro @ 384, and LT @ 1415, at which level should i cover my shorts, or hold at what levels
regards
The stop is more important – 390 and 1450. Watch 353 on wipro if it closes below it the old tgts are back. LT might fill the gap at 1350 and then spend time in this region
thanks
jai