Reliance: When two independent charting methods speak the same language
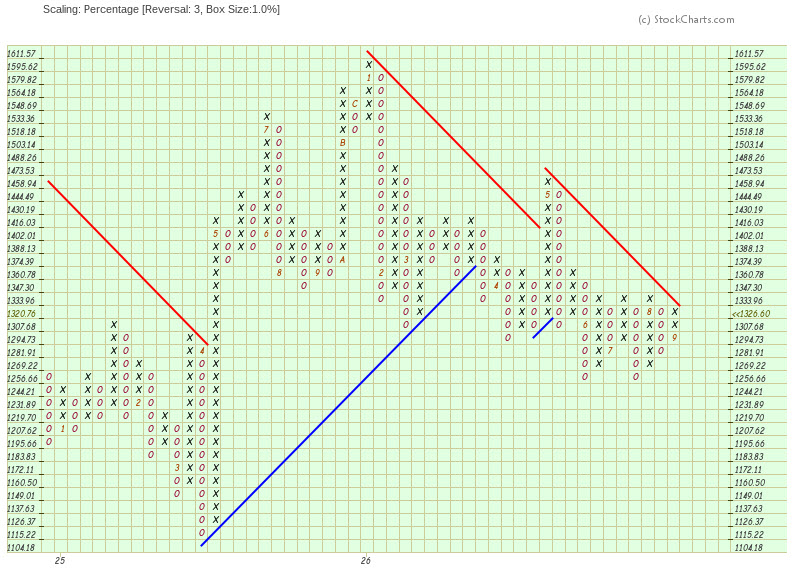
Point & Figure charts filter out noise and focus purely on structural price behaviour. On the latest P&F print, Reliance is very close to trigger the 1335-1340 zone – a level that marks a clean breakout on a 1% box, 3‑box reversal chart.
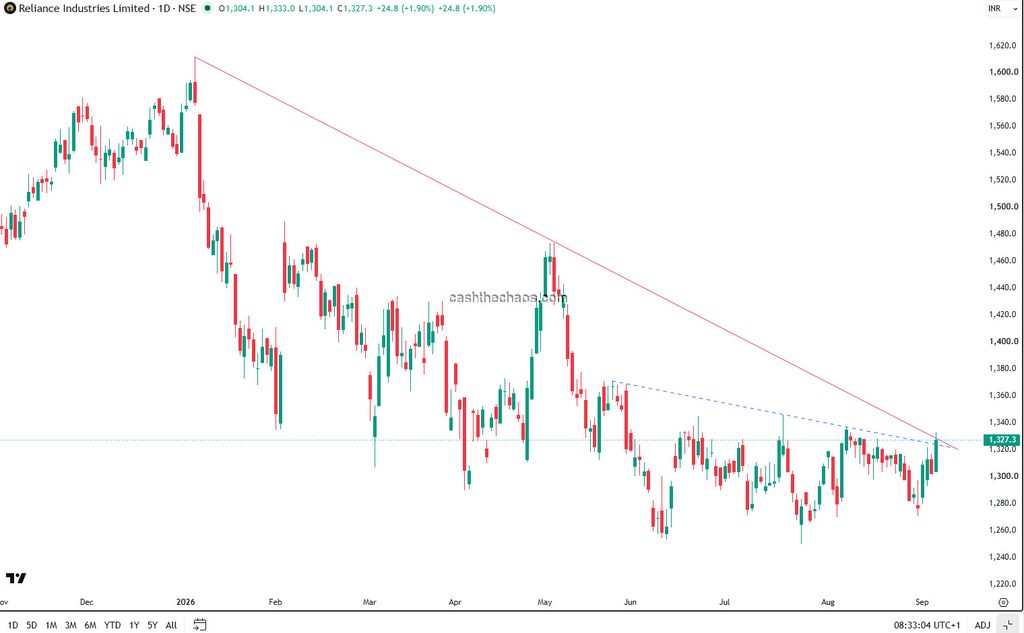
The daily candlestick chart is showing the same shift -would trigger an inverse Head & Shoulders – on a close above 1325, a pattern that often signals a transition from distribution to accumulation. (Perhaps this could become, a 3rd touch point on a trendline from ATH, back up a bit and then pierce the trendline)
This comes at an interesting time for the broader market. The cap-weighted Nifty has been a relative laggard vs equal-weighted Nifty, largely because heavyweights like Reliance and HDFC have acted as a drag. A structural breakout in Reliance doesn’t “fix” that on its own – but it could remove one of the key pressures that has capped Nifty’s momentum in recent months.
When structural signals align across methodologies – one time‑agnostic (P&F) and one time‑based (candlesticks) – it’s worth paying attention. Not as a prediction, but as a reminder that markets often communicate turning points through price long before narratives catch up.